
Results
Every number here, with source and date.
See how our homes perform, compare them with the market, and check the original reports. Each comparison identifies its group and dates. Choose the question you want to investigate below.
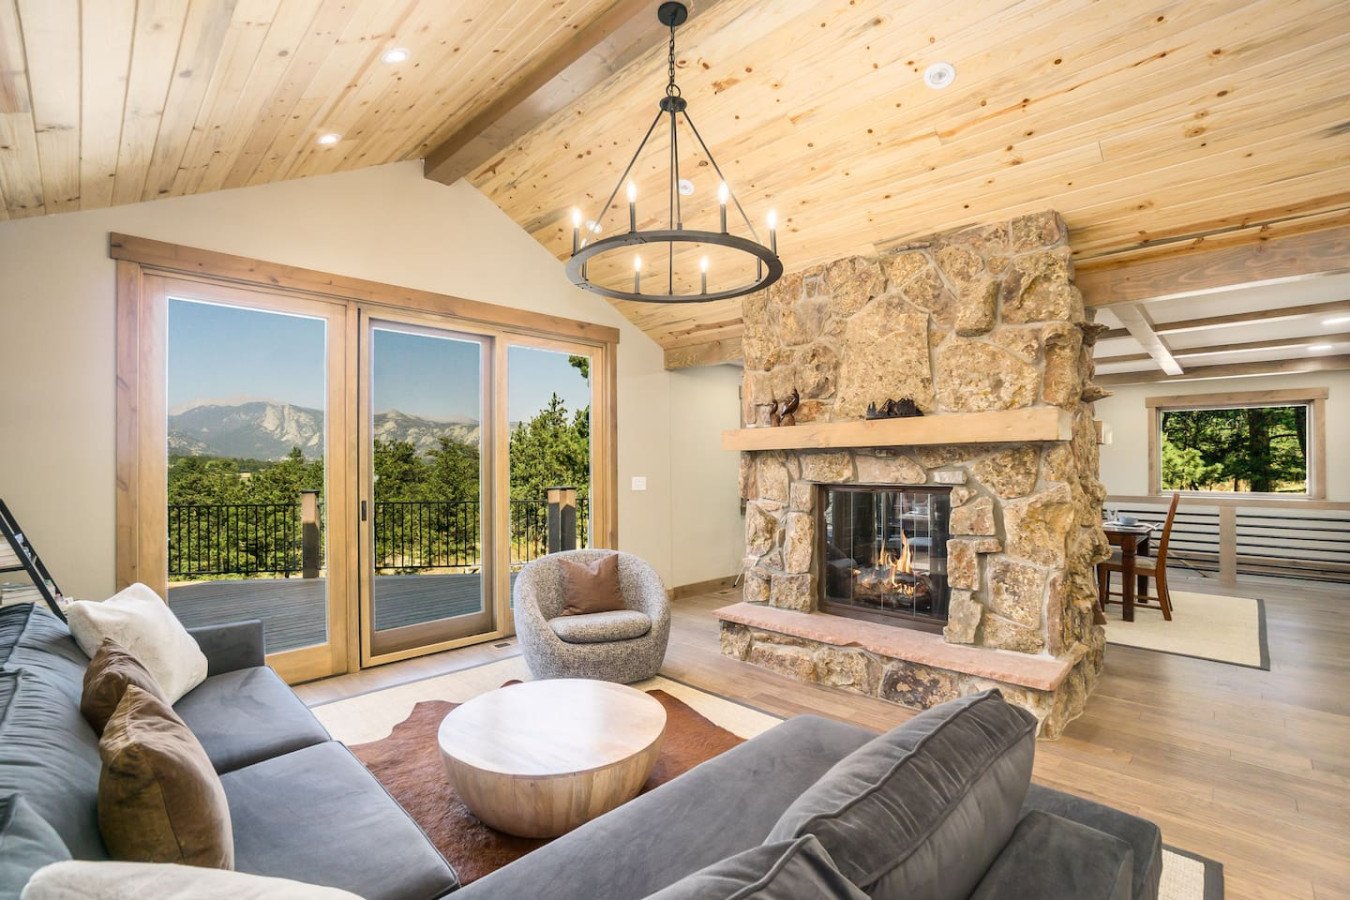
Sunset Lodge. Real homes, measured results.
A 4.94 guest rating. More than 7,500 reviews in a year.
4.94
Average Airbnb rating, 116 homes, 12 months.
95%
Of 7,540 reviews were five stars.
98%
Five stars for communication: 7,400 of 7,540.
Every
Quarter since we started hosting, Airbnb has rated us Superhost.
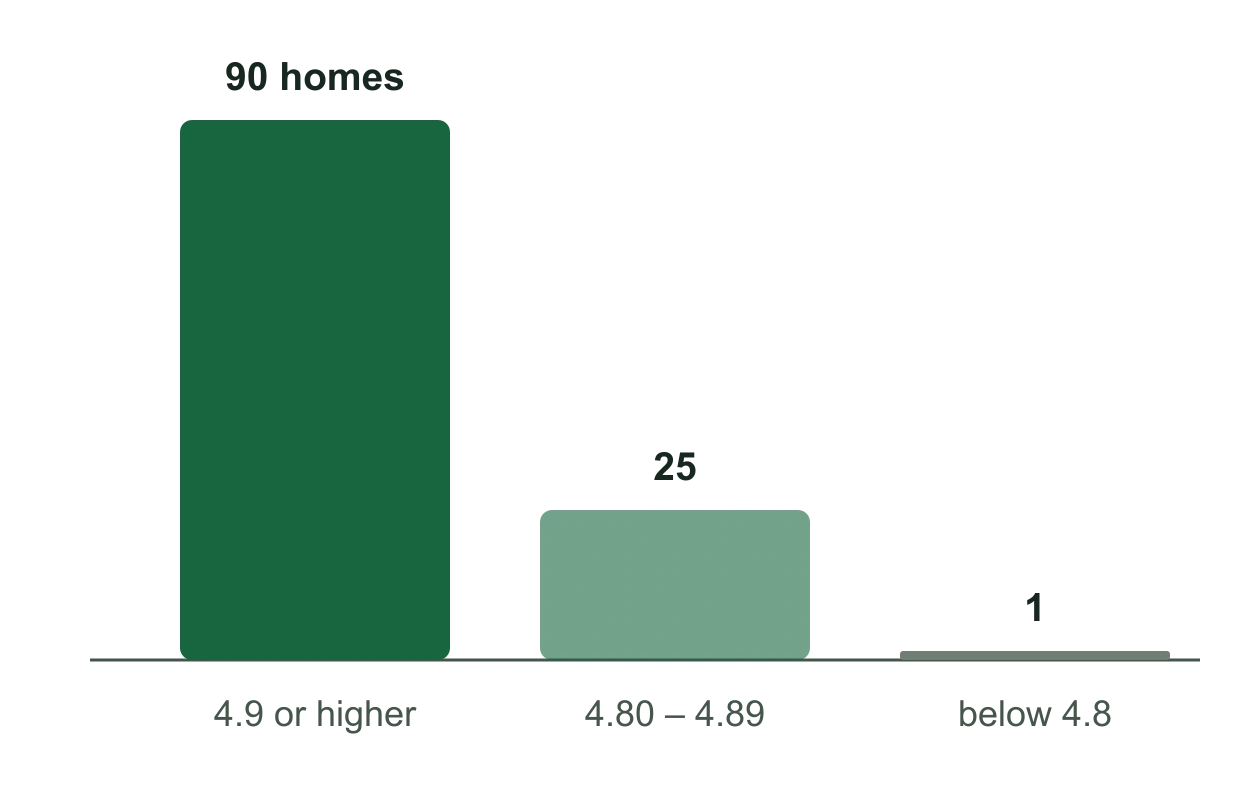
115 of 116 homes averaged 4.8 or higher in the last twelve months
Homes by average Airbnb rating, reviews submitted Sep 13, 2025 – Sep 12, 2026.
| Group | Value |
|---|---|
| 4.9 or higher | 90 homes |
| 4.80 – 4.89 | 25 |
| below 4.8 | 1 |
Source: trailing-12-month review analysis, Hostaway export Sep 13, 2026. Per-home means use unrounded values.
These are recent averages, not lifetime scores, so they show the operation as it runs today. Ninety of 116 homes averaged 4.9 or higher. The single home below 4.8 is the exception we work on, not the one we hide.
Roughly 70% of our guests leave a review. The median home has more than 250 Airbnb bookings behind it, and 96 of 117 have more than 100. A rating built on that many stays is hard to move by luck in either direction.
Source reports: Guest ratings
Nearly all of our homes are Guest Favorites.
97%
Of listings carry the Guest Favorite badge.
75
Highlighted by Airbnb as top 10% or better.
41
Top 5% or better.
6
Top 1%.
A Guest Favorite is one of Airbnb’s most-loved homes, chosen from guest ratings, reviews and reliability. The badge appears in search, and guests can filter for it. 113 of our 117 listings have earned it.
97%
The Wolf’s homes are Airbnb Guest Favorites
92%
AirDNA’s national winner for the share of guest-loved, platform-badged homes
Our share is higher than every company in AirDNA’s published 2026 badge-share top five. AirDNA’s award covers platform-badged homes; our figure counts Airbnb Guest Favorites.
The Wolf: 113 of 117 listings, September 13, 2026. Percentages rounded. How Airbnb chooses Guest Favorites. AirDNA’s 2026 national comparison. Badges are re-evaluated daily.
Source reports: Guest Favorite report
Every other Estes Park manager with 45+ homes scores 4.65 to 4.84.
Guest ratings vs. portfolio size
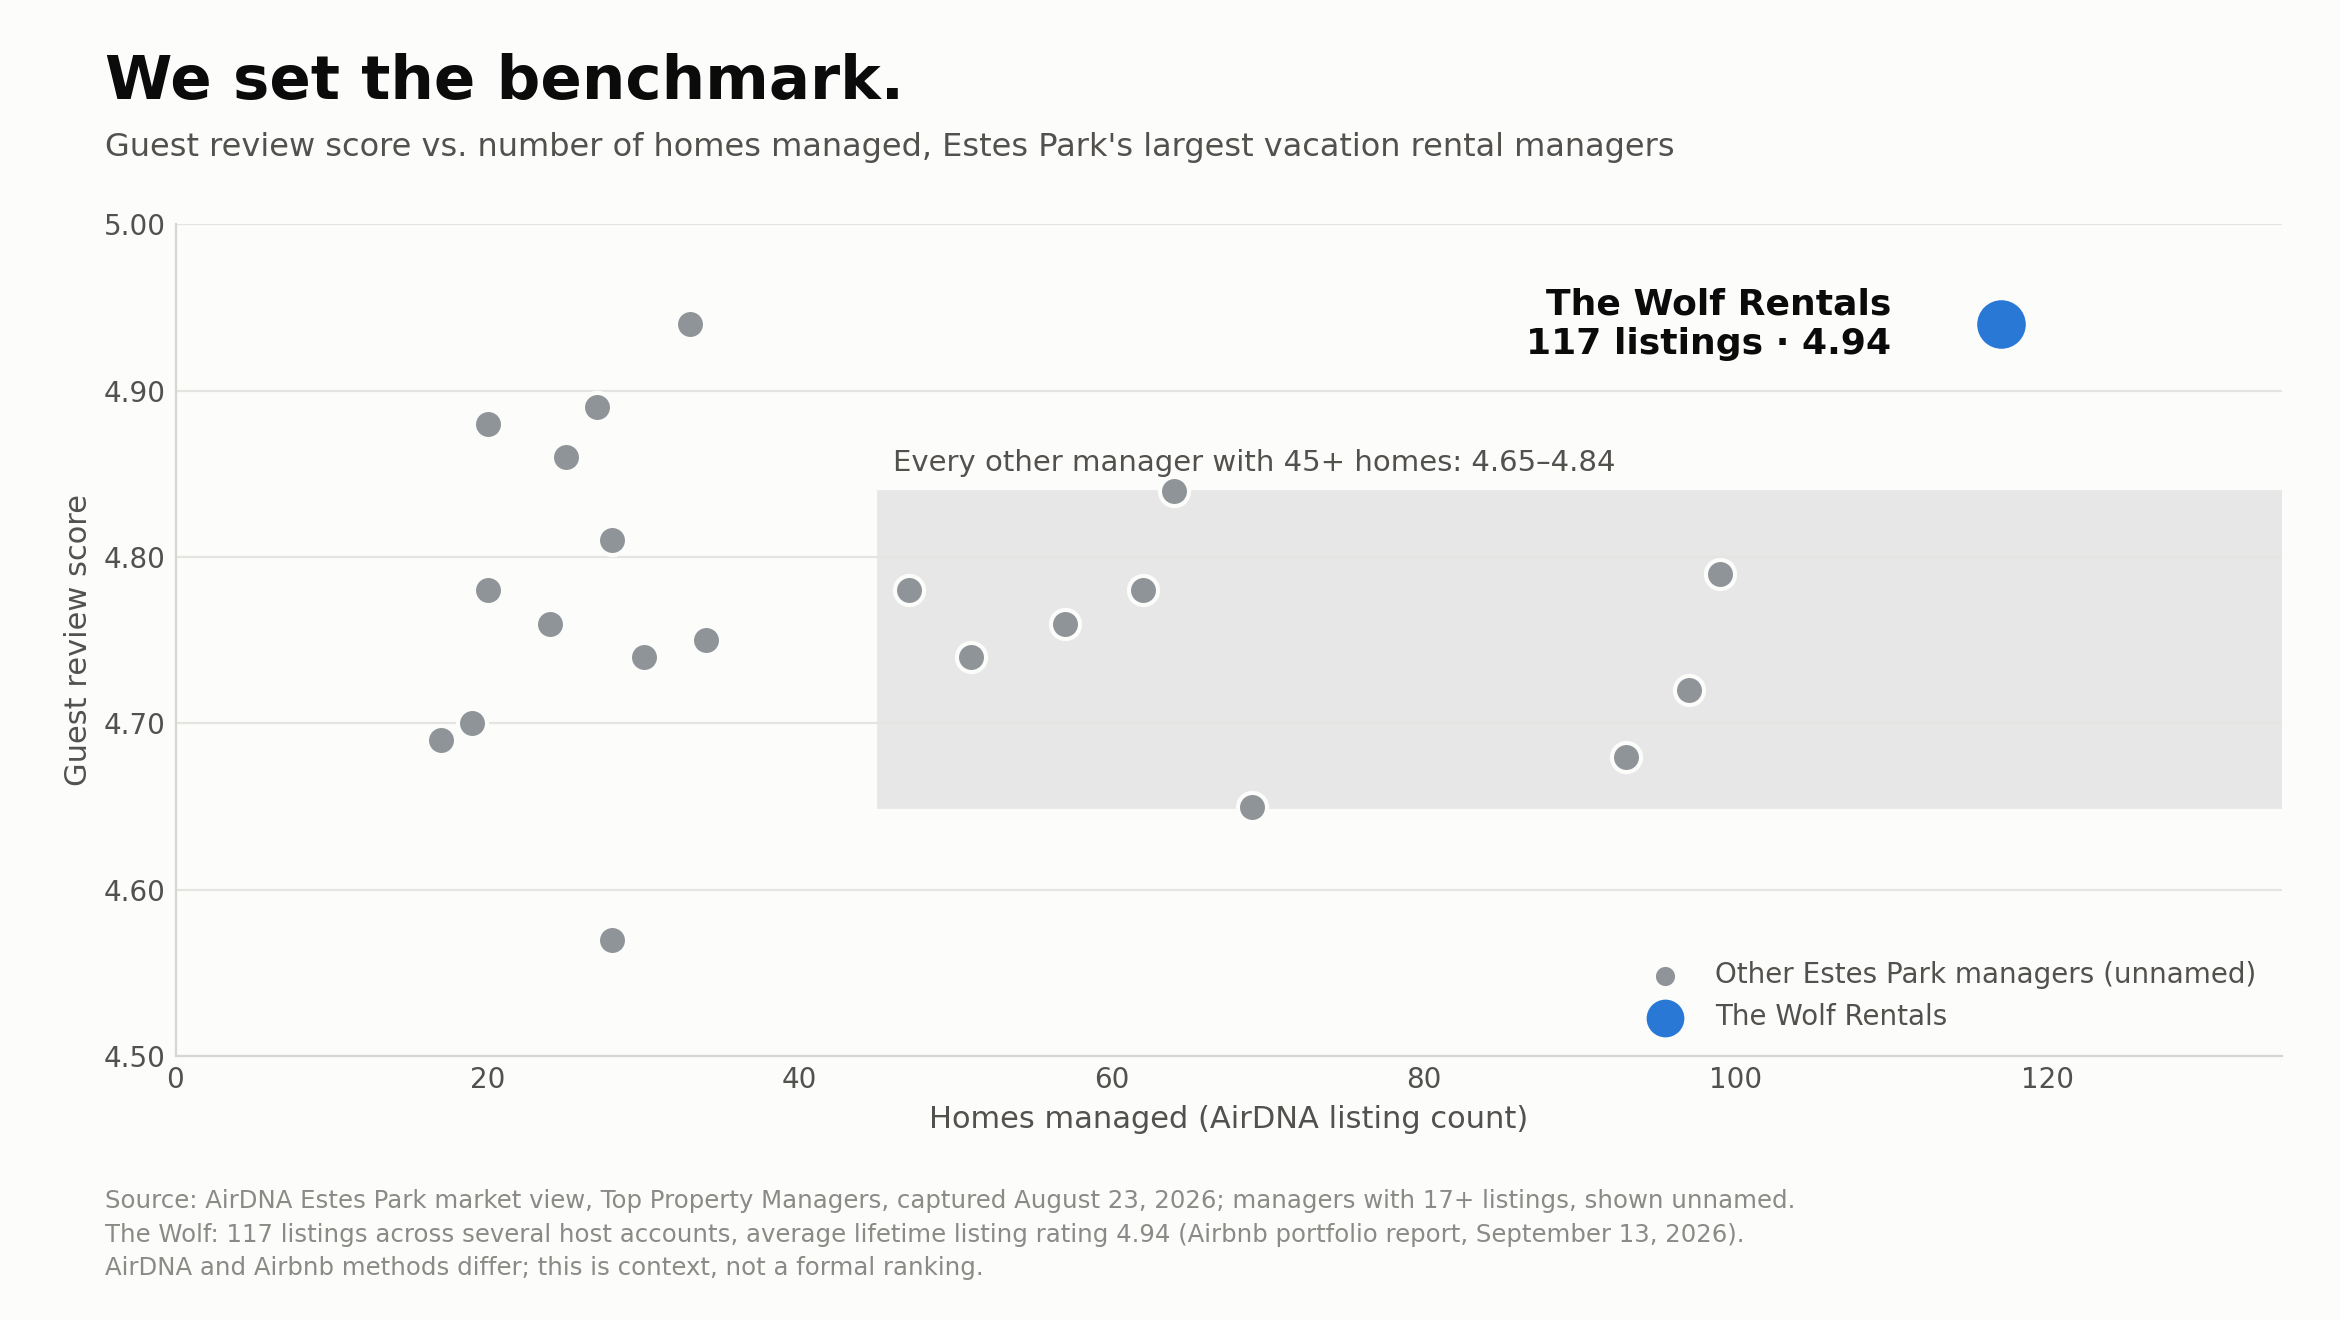
Select the graph to enlarge it.
Source: AirDNA Estes Park market data, August 2026, managers with 17+ listings; The Wolf’s portfolio spans several host accounts; its Airbnb review score is shown alongside the AirDNA market figures. AirDNA’s 2026 local winner for the Rocky Mountain National Park market, at 4.97, is Solitude, a group of 22 cabins run by The Wolf.
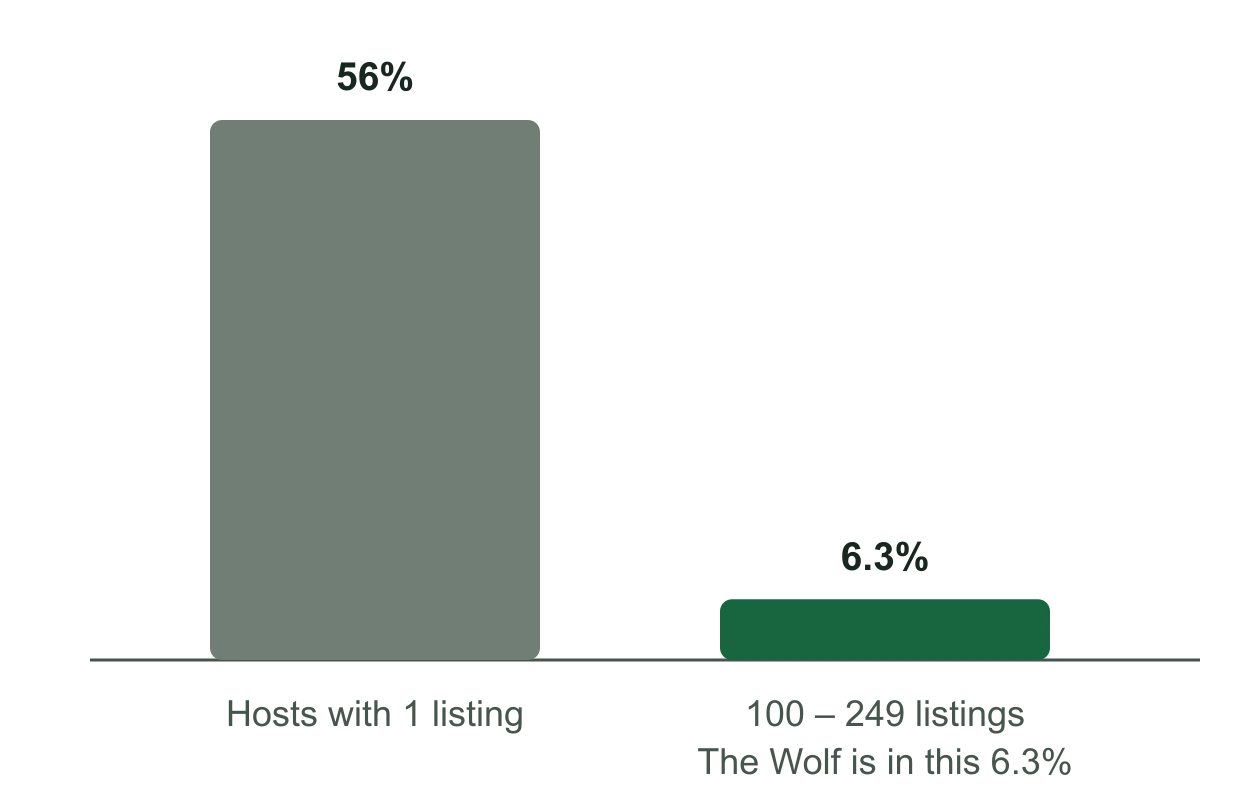
Top ratings are common at one listing and rare at a hundred
Share of U.S. hosts rated 4.9 or better, by portfolio size.
| Group | Value |
|---|---|
| Hosts with 1 listing | 56% |
| 100 – 249 listingsThe Wolf is in this 6.3% | 6.3% |
Source: AirDNA, Best Airbnb Management Companies in the US, 2026.
AirDNA tracks about 960,000 hosts in the United States. Only 920 of them manage more than 100 listings. In our size class, 100 to 249 listings, the average rating is 4.71 and 6.3% of managers hold a 4.9 or better. The Wolf is a 4.94 across 117 listings. AirDNA’s 2026 national top ten runs from 4.94 to 4.96.
One caution we’d rather state than have you find: AirDNA’s ratings are review-weighted across Airbnb, Vrbo and Booking.com, while our 4.94 is Airbnb’s dashboard. They’re shown together for context, not as one ranking.
Source reports: Local comparison
National benchmark: AirDNA’s 2026 management-company research. The Wolf figure uses Airbnb reviews; the AirDNA figures use cross-platform reviews.
Higher than the strong comparable homes on every category Airbnb measures.
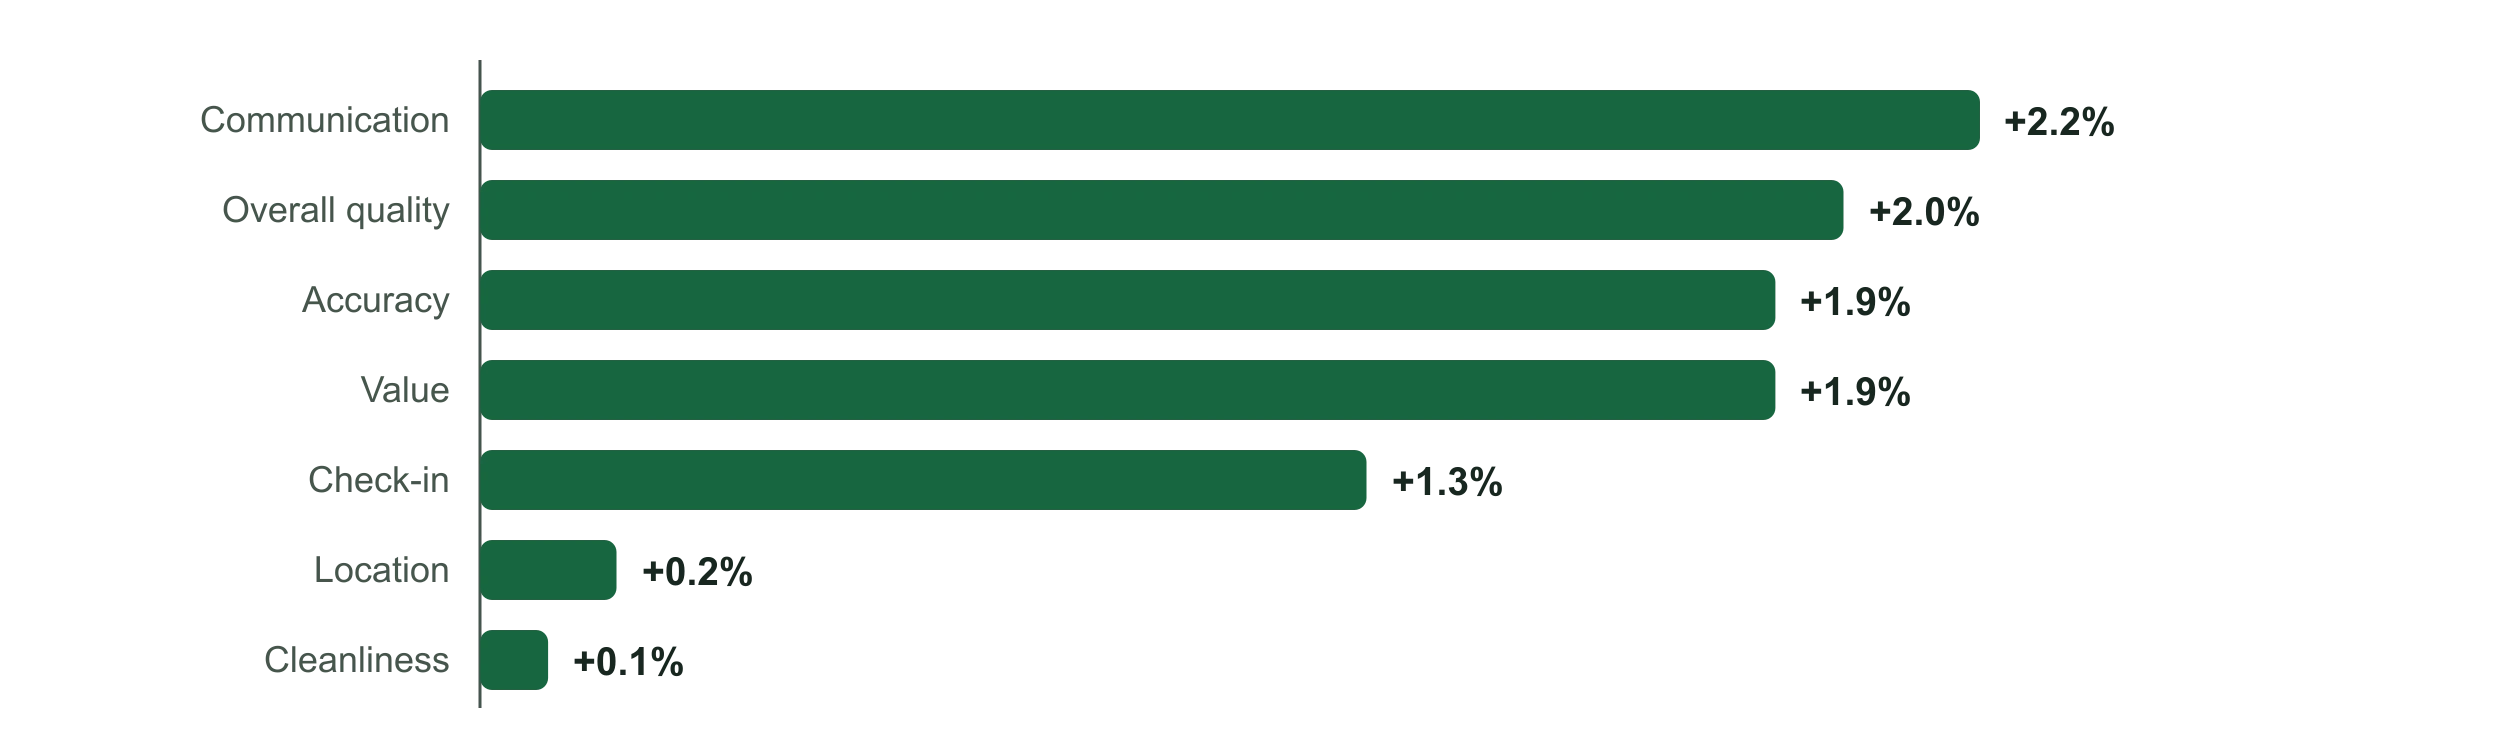
Five-star share vs. “similar listings,” by category
Airbnb’s own readout: how much more often our homes earn five stars than comparable listings in the area. Year ending Sep 25, 2026.
| Category | Difference |
|---|---|
| Communication | +2.2% |
| Overall quality | +2.0% |
| Accuracy | +1.9% |
| Value | +1.9% |
| Check-in | +1.3% |
| Location | +0.2% |
| Cleanliness | +0.1% |
Source: Airbnb professional hosting dashboard, all listings, Sep 26, 2025 – Sep 25, 2026.
Airbnb grades every home against “similar listings,” the comparable homes in the area. The five-star shares are already high, so these are small differences. We’re above the comps in all seven categories, and the two where we lead most, communication and overall quality, are the two a manager controls most directly.
+35.2%
Occupancy vs. similar listings, same Airbnb readout. That gap isn’t small.
Guests see our homes first.
60%
Of our search impressions are on Airbnb’s first page.
104,066
First-page search impressions per listing, per year.
11,618
Listing page views per listing, per year.
1.14M
More page views than similar listings, across the portfolio.
Airbnb ranks by ratings, reviews and reliability, so the review record above becomes search placement, and search placement becomes demand. Airbnb reports our listings drew 1,136,828 more page views than similar listings over the last year. Demand is what a revenue manager prices.
Airbnb dashboard, Aug 23, 2025 – Aug 22, 2026, 116 listings (first-page rate and per-listing averages); page-views comparison, all listings, Sep 25, 2025 – Sep 24, 2026.
Source reports: Listing views
How do homes your size perform?
Compare one-bedroom homes with one-bedroom homes, two with two. Start with revenue, then see how often each group is booked.
| Home size | The Wolf | Market | More revenue |
|---|---|---|---|
| 1 bedroom | $170 | $109 | 56% |
| 2 bedrooms | $178 | $165 | 8% |
Revenue earned per available night, including unbooked nights, before fees and property expenses. Key Data, September 26, 2025–September 26, 2026. Matched by bedroom count; other features and availability may differ. Percentage differences use the report’s rounded dollar values. 1-bedroom report · 2-bedroom report
Key Data, September 26, 2025–September 26, 2026. Active homes, grouped by bedroom count; adjusted paid occupancy excludes owner blocks. Other property features and availability can still differ. This table compares occupancy, not revenue.

Our established portfolio earned 70% more revenue.
This is a portfolio-wide comparison, separate from the bedroom groups above. Homes managed throughout the period earned $269 per available night against the Greater Estes Park market’s $158, before fees and property expenses. Available nights include booked and unbooked nights and exclude owner blocks. The property mixes differ.
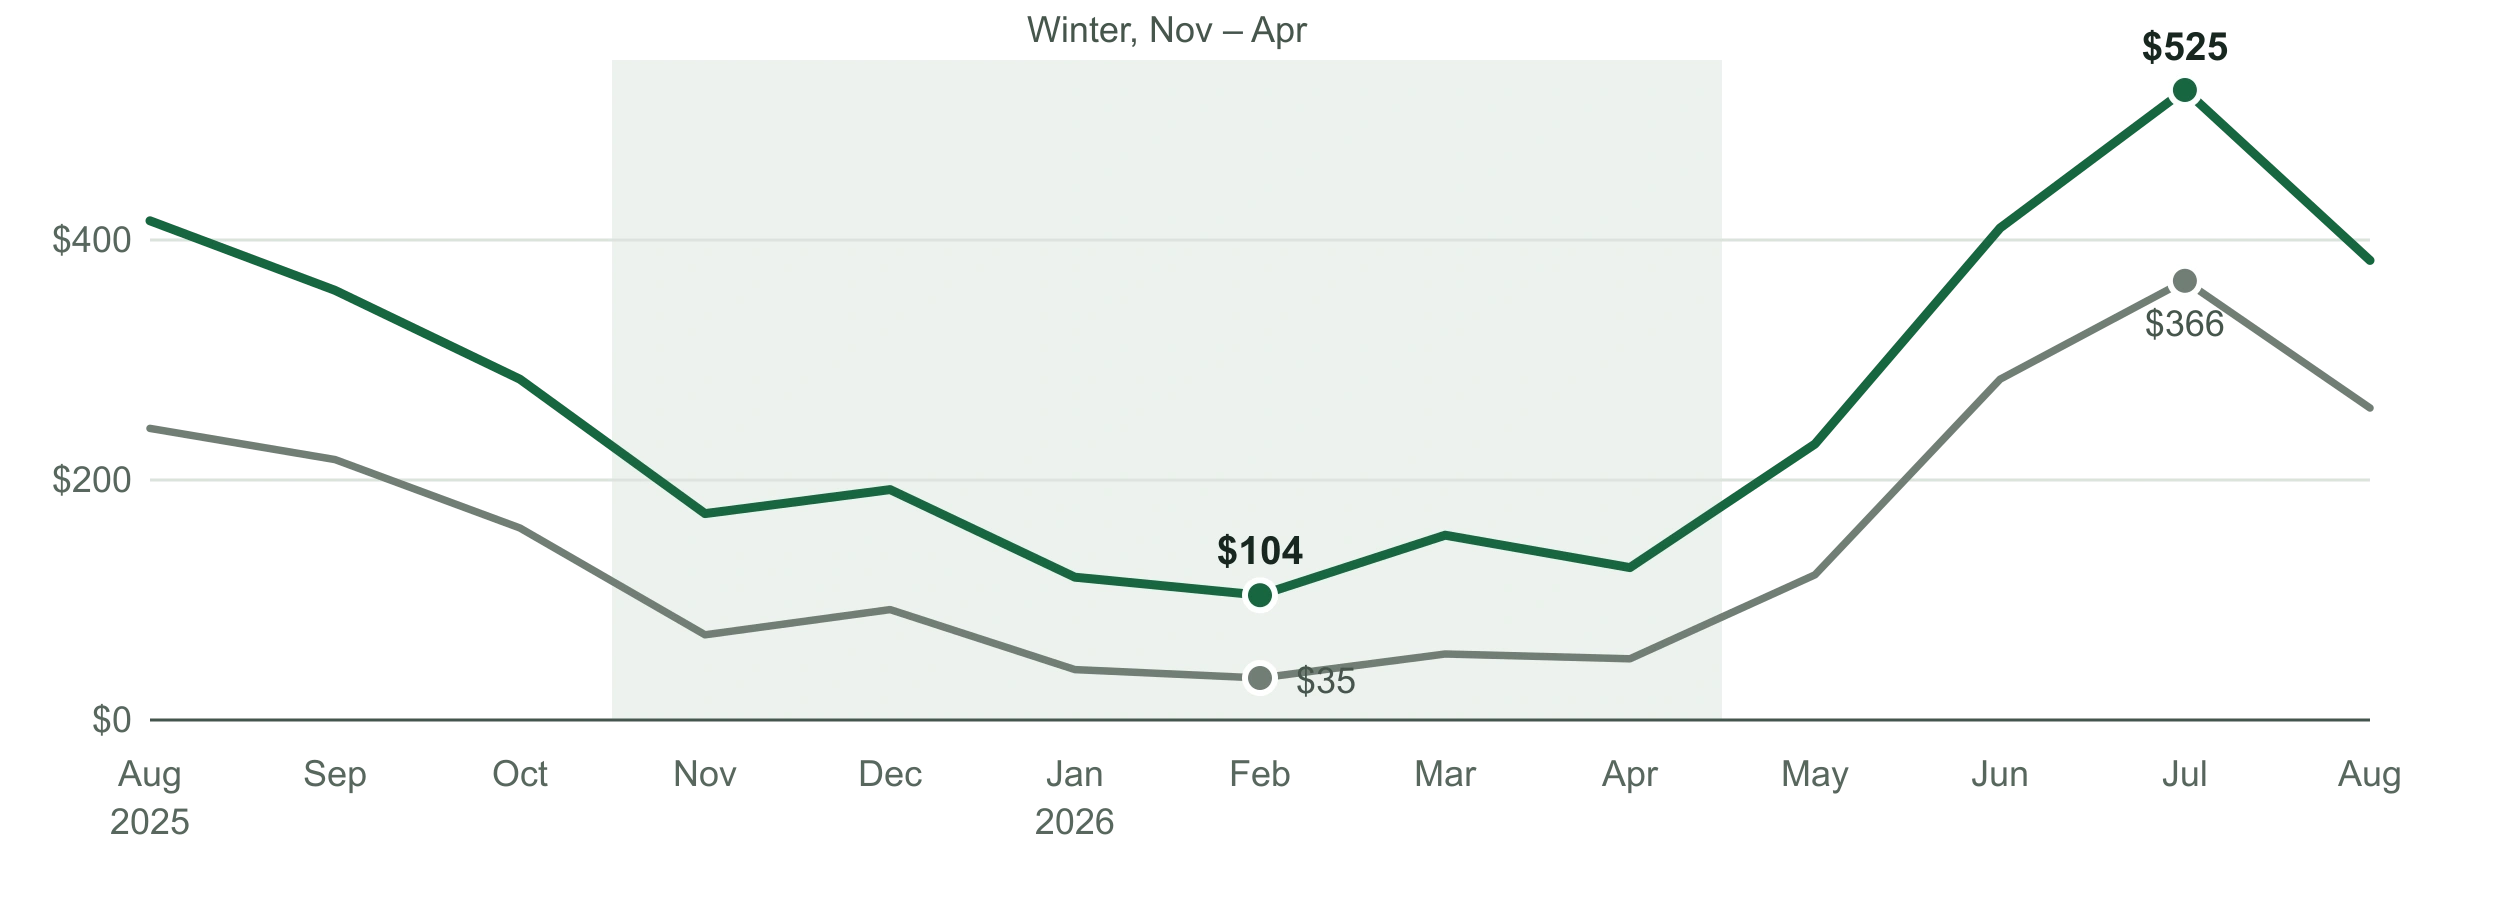
Revenue per available night, The Wolf vs. Greater Estes Park
What each night on the calendar earned, booked or not, before fees and expenses. Aug 2025 – Aug 2026.
| Month | The Wolf | Market |
|---|---|---|
| Aug 2025 | $416 | $243 |
| Sep 2025 | $358 | $217 |
| Oct 2025 | $284 | $160 |
| Nov 2025 | $172 | $71 |
| Dec 2025 | $192 | $92 |
| Jan 2026 | $119 | $42 |
| Feb 2026 | $104 | $35 |
| Mar 2026 | $154 | $55 |
| Apr 2026 | $127 | $51 |
| May 2026 | $230 | $121 |
| Jun 2026 | $410 | $284 |
| Jul 2026 | $525 | $366 |
| Aug 2026 (to Aug 23) | $383 | $260 |
The Wolf, $269 per available night for the comparison period
Estes Park market, $158
Source: Key Data, Same Store 2026 vs. Direct (Greater Estes Park), Aug 1, 2025 – Aug 23, 2026. Hover any month for both figures.
| Aug 2025 – Aug 2026 | The Wolf | Estes Park market |
|---|---|---|
| Occupancy (adjusted paid) | 80.2% | 43.2% |
| Revenue per available night | $269 | $158 |
| Average nightly rate | $336 | $365 |
| July nightly rate, 96% of nights sold | $545 | $496 |
Our full calendar includes more shoulder and winter nights, which affects the mix of nightly rates in the period’s average. When demand is strong we price for it: in July our average rate was $545 against the market’s $496, with 96% of nights sold. Guests still rate our value 1.9% above similar listings.
Two portfolio views, with different reporting windows. The $269 figure is “same store”: the homes that were with us for the whole period. The full-portfolio report covers September 25, 2025–September 25, 2026 and includes homes taken over during the year: $221 versus $158 per available night, or 40% more, at 75.7% occupancy. The same-store comparison shown above covers August 2025–August 2026, with its final month captured August 23. The different groups and dates should be considered when comparing the two results.
Monthly values behind the chart
| Month | Wolf occupancy | Market occupancy | Wolf rev / avail. night | Market rev / avail. night |
|---|---|---|---|---|
| Aug 2025 | 96.7% | 62.9% | $416 | $243 |
| Sep 2025 | 94.3% | 61.4% | $358 | $217 |
| Oct 2025 | 88.7% | 50.4% | $284 | $160 |
| Nov 2025 | 68.6% | 24.9% | $172 | $71 |
| Dec 2025 | 64.8% | 27.9% | $192 | $92 |
| Jan 2026 | 56.7% | 16.1% | $119 | $42 |
| Feb 2026 | 57.1% | 15.4% | $104 | $35 |
| Mar 2026 | 77.4% | 23.9% | $154 | $55 |
| Apr 2026 | 69.0% | 21.4% | $127 | $51 |
| May 2026 | 85.1% | 40.9% | $230 | $121 |
| Jun 2026 | 94.8% | 65.9% | $410 | $284 |
| Jul 2026 | 96.3% | 73.7% | $525 | $366 |
| Aug 2026 (to Aug 23) | 90.4% | 64.9% | $383 | $260 |
Source reports: Revenue · Occupancy · Report filters
The dead of winter: 57% booked against 15%.
3.7×
The market’s occupancy in February 2026: 57.1% vs. 15.4%.
$104
Per available night in February, against $35 for the market.
57–77%
Occupancy every month from November through April, while the market ran 15% to 28%.
Summer sells itself in a national park town. Winter is where managers differ, and it’s also when an empty house is most at risk. A home that’s booked in February is heated, used and watched, and the guests who come in February are the ones a listing has to earn on its own merits.
Key Data, Same Store 2026 vs. Direct (Greater Estes Park), monthly adjusted paid occupancy, Nov 2025 – Apr 2026. The whole portfolio, including mid-year takeovers, ran 53% to 73% against the same market.

Winter is part of the annual result.
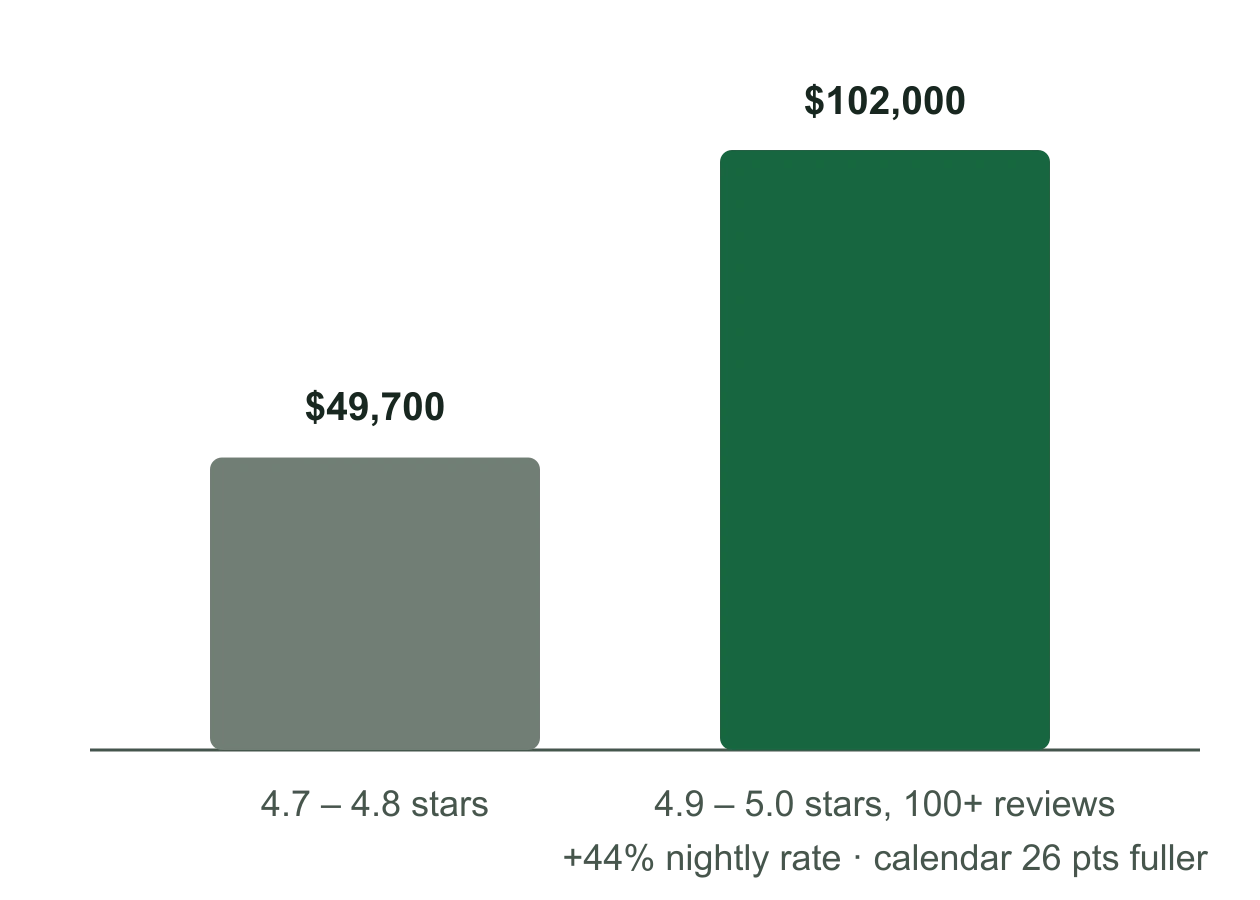
A 4.9 earns about twice what a 4.7 earns.
This is the link between the rating pages and the revenue pages. PriceLabs estimated annual revenue for two groups of comparable 3-bedroom, 2-bath Estes Park cabins, split by guest rating: $49,700 at 4.7 to 4.8 stars and $102,000 at 4.9 to 5.0 with 100 or more reviews. The higher group commands a 44% higher nightly rate and a calendar 26 points fuller.
The estimate shows the size of the gap between rating tiers in this market. It doesn’t promise what one home gains by moving tiers, and the groups contain different homes. It shows why guest ratings belong in the conversation about income, alongside the home’s features, availability and pricing.
Estimated annual revenue, comparable 3BR/2BA Estes Park cabins
Two groups of similar cabins, split by guest rating.
| Group | Value |
|---|---|
| 4.7 – 4.8 stars | $49,700 |
| 4.9 – 5.0 stars, 100+ reviews+44% nightly rate · calendar 26 pts fuller | $102,000 |
Source: PriceLabs Revenue Estimator Pro, Sep 25, 2026; 3 bedrooms, 2 baths, 6 guests, entire cabins. Excludes taxes, cleaning and other charges.
Source reports: 4.7–4.8 group · 4.9–5.0 group
The badge that gets booked.
Guest Favorites took nearly half of all Airbnb bookings in Q4 2025. 113 of our 117 homes have it.
Better placement.
Airbnb says higher-quality homes with better reviews tend to rank higher. Guest Favorites also stand out with a search badge and a filter that lets guests see only those homes.
Fewer guest problems.
Airbnb reported 80–90% fewer support contacts for Guest Favorites than for its bottom-quarter listings, alongside stronger repeat booking.
Earned home by home.
Ratings, reviews and reliability decide it. 97% of our portfolio qualifies. That is the guest experience behind the bookings.
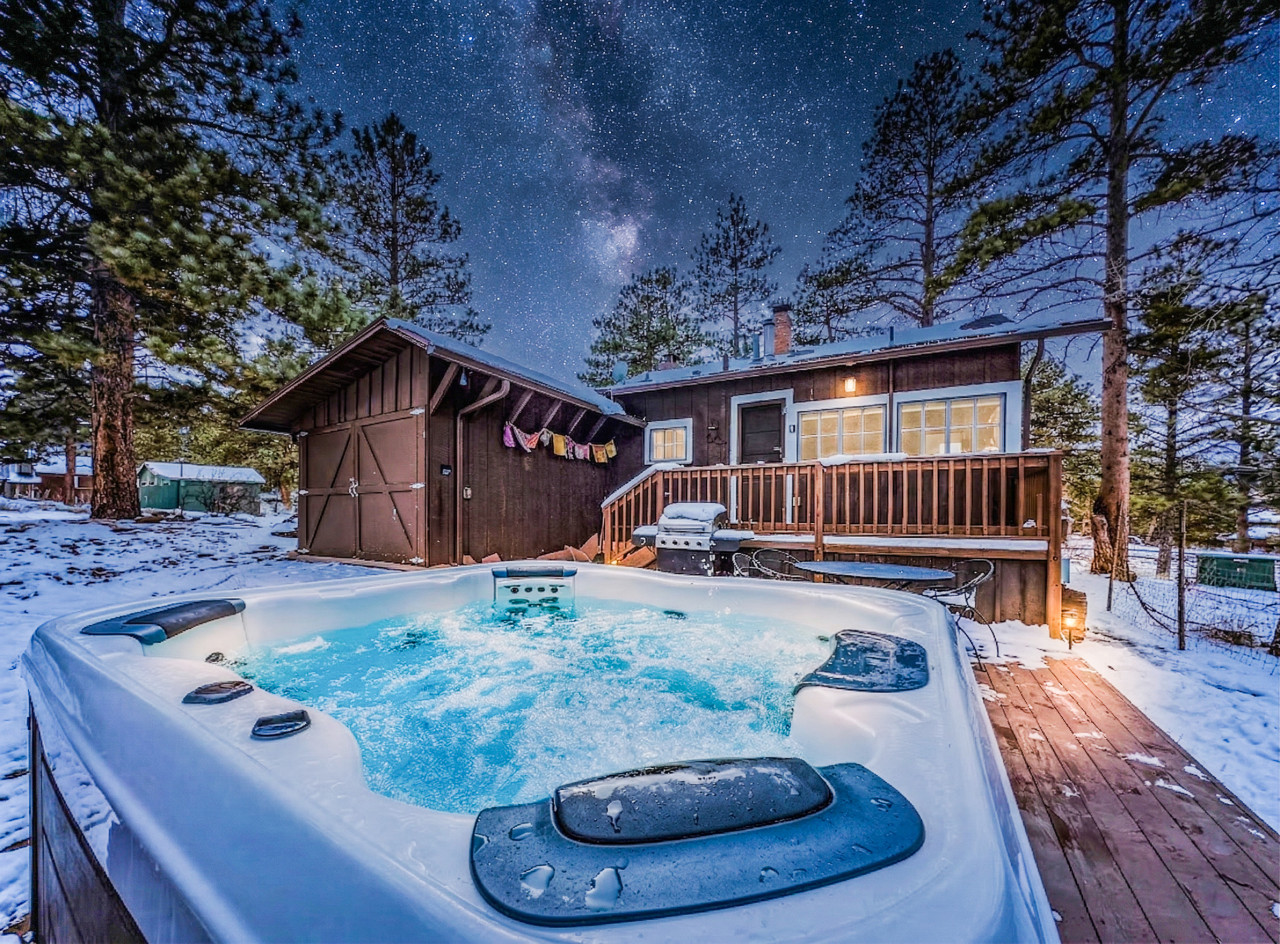
What changed when The Wolf took over: about $21,000 to $68,610 for the owner.
| One-bedroom cabin, annual | Before The Wolf | Under The Wolf |
|---|---|---|
| Retained by the owner, before other property expenses | about $21,000 | $68,610 |
| Booked nights | 184 | 356 |
| Management fee | 15% | The Wolf’s fee |
A small one-bedroom cabin with views and a hot tub, with years of rental history under a previous manager who charged 15%. In the year we documented, the owner kept about $48,000 more. The fee was higher. What was left for the owner was more than three times as much.
That is why we ask owners to compare the outcome rather than the percentage. A low fee is only useful if the business underneath it performs.
Historical case: the year under The Wolf ended July 31, 2023; the prior manager’s year is undated in the original record. Owner-retained amounts are after management fees, before other property expenses; the earlier amount is rounded. Not the present 120-home cohort.
We doubled in size in 2025. The scores didn’t move.
~95%
Five-star share, held through the year we doubled inventory.
+45%
2026 recognized revenue across the portfolio vs. 2025: $8.25M vs. $5.67M.
+48%
Guest check-ins, 10,402 vs. 7,013.
Owners trust The Wolf with 120 homes worth roughly $92 million. For 2027 we’re planning for about 13,000 reservations, 32,000 booked property nights, 44,000 guest arrivals, 114,000 guest nights and $16 million in total guest spend. Those are planning figures, not results, and guest spend is not owner income. We publish them because the responsibility grows with the volume, and so does the team.
Key Data Company Overview, calendar 2026 as of Sep 25 vs. calendar 2025 as of Sep 26, 2025; a growing portfolio, not same-store growth. Portfolio value is The Wolf’s Sep 2026 estimate of owners’ homes under management, not company-owned real estate.
Find out what your home could earn.
Nathan will review your home, its competition and guest reviews, plus any pricing and performance information you can share, to estimate what it could do with The Wolf.
Sources and definitions
Airbnb dashboard. Professional hosting dashboard, Aug 23, 2025 – Aug 22, 2026, 116 selected listings, captured Aug 23, 2026: overall rating, five-star share, first-page search impression rate (60.0%), and per-listing averages of 104,066 first-page search impressions and 11,618 page views. Page-views comparison: all listings, Sep 25, 2025 – Sep 24, 2026; “1,136,828 higher than similar listings” is Airbnb’s own readout. Category comparisons and occupancy: all listings, Sep 26, 2025 – Sep 25, 2026, captured Sep 25, 2026; each figure is Airbnb’s own “higher than similar listings in the area” readout for the five-star share in that category. Airbnb defines “similar listings” as comparable listings in the area and compares against their average. Superhost status per Airbnb’s quarterly assessments.
Trailing-12-month review analysis. Hostaway guest-review export dated Sep 13, 2026; Airbnb reviews submitted Sep 13, 2025 – Sep 12, 2026. 7,540 reviews across 116 Estes Park homes; review-weighted mean 4.94, 95% five-star. Communication: 7,400 of 7,540 ratings were five-star (98%). Per-home means use unrounded values: 90 at least 4.90; 115 at least 4.80. These are recent-review averages, not Airbnb’s lifetime listing scores. Kentucky homes, Rock Nook and Estes Park Outfitters Lodge are excluded consistently with the portfolio’s review analysis. Review rate is The Wolf’s internal calculation: reviews received divided by completed stays, approximately 70%.
Airbnb portfolio report, Sep 13, 2026. 117 unique listings: Guest Favorite and highlight designations (groups overlap; all 75 highlighted homes are Guest Favorites), lifetime average rating per listing, and lifetime and trailing-365-day booking counts (Airbnb’s counts include cancellations). Designations are re-evaluated by Airbnb daily; this is a dated snapshot.
Key Data, same store. Custom group “Same Store 2026” vs. “Direct (Greater Estes Park),” Aug 1, 2025 – Aug 31, 2026, as of Aug 23, 2026; a 13-month window with an unfinished final month; different property mixes. Adjusted paid occupancy is booked nights over available nights, with owner blocks removed. Revenue per available night is rate times occupancy: what each night on the calendar earned, booked or not, before management fees and property expenses. Average nightly rate is revenue per booked night.
Key Data, full portfolio. Company Overview, Sep 25, 2026: all active units vs. Direct (Greater Estes Park), Sep 25, 2025 – Sep 25, 2026: 75.7% vs. 42.8% occupancy and $221 vs. $158 per available night; monthly adjusted paid occupancy Nov 59.3%, Dec 61.3%, Jan 53.3%, Feb 54.8%, Mar 73.4%, Apr 65.6% vs. market 25.8%, 28.8%, 16.4%, 16.0%, 24.5%, 21.6%. Growth: calendar 2026 as of Sep 25 vs. calendar 2025 as of Sep 26, 2025: unit revenue recognized $8,250,542 vs. $5,672,216 (+45.5%), guest check-ins 10,402 vs. 7,013 (+48.3%). A changing portfolio; not same-store growth.
PriceLabs. Revenue Estimator Pro, reports created Sep 25, 2026, for one Estes Park address; 3 bedrooms, 2 bathrooms, entire cabins, 6 guests. Groups contain different homes; the higher group combines rating with 100+ reviews. Estimated revenue excludes taxes, cleaning fees and other charges. The comparison shows the size of the gap between rating tiers in this market, not what one home would gain by moving tiers.
AirDNA. “Best Airbnb Management Companies in the US (2026),” Aug 2026: national funnel (960,000 hosts → 220,000 → 7,168 → 920 → 668 → 212 → 18 → 10), share of hosts at 4.9+ and average rating by portfolio size, the Guest Loved & OTA Badged award (92% top), and the top ten (4.94 – 4.96 as displayed). Local winners and the Estes Park top property managers table from AirDNA’s market data, August 2026 (managers with 17+ listings; The Wolf’s homes sit under several host accounts and are combined into one point). AirDNA’s ratings are review-weighted across Airbnb, Vrbo and Booking.com; Airbnb’s dashboard rating is Airbnb only. Shown together for context.
Takeover case. Adapted from The Wolf’s published case study. The under-The-Wolf annual period ended July 31, 2023; the prior manager’s annual period is not dated in the source. Owner-retained amounts are after management fees, before other property expenses; the earlier amount is rounded. Historical figures, not the present cohort.
Portfolio and forecasts. Property value is The Wolf’s Sep 2026 estimate of owners’ homes under management, not company-owned real estate. 2027 figures are rounded planning forecasts, not results; guest spend is not owner income or company revenue.
Estes Park vacation rental management
The Wolf Rentals · Estes Park, Colorado