For owners / Results
Big claims. Here’s the proof.
Check the guest ratings. Compare the performance. Open the source images and see the numbers for yourself.
4.94. The guests have spoken.
| Measure | Result |
|---|---|
| Overall Airbnb rating, 116 listings | 4.94 |
| Five-star ratings | 95.1% |
| Five-star communication ratings, latest 12-month review analysis | 98.1% (7,400 of 7,540) |
| Listings that are Airbnb Guest Favorites | 113 of 117 (96.6%) |
| Listings with a top 10% or better Airbnb highlight | 75 of 117 |
| Homes averaging 4.9 or higher in the latest 12-month review analysis | 90 of 116 |
| Homes averaging 4.8 or higher in the latest 12-month review analysis | 115 of 116 (99.1%) |
Why it matters: Airbnb ranks and badges by quality, and guests filter for Guest Favorites. Your home gets seen. And a rating this high across this many homes is evidence the care is reaching the guest, every turnover, in every house. We've also been Superhosts every quarter since we started hosting.
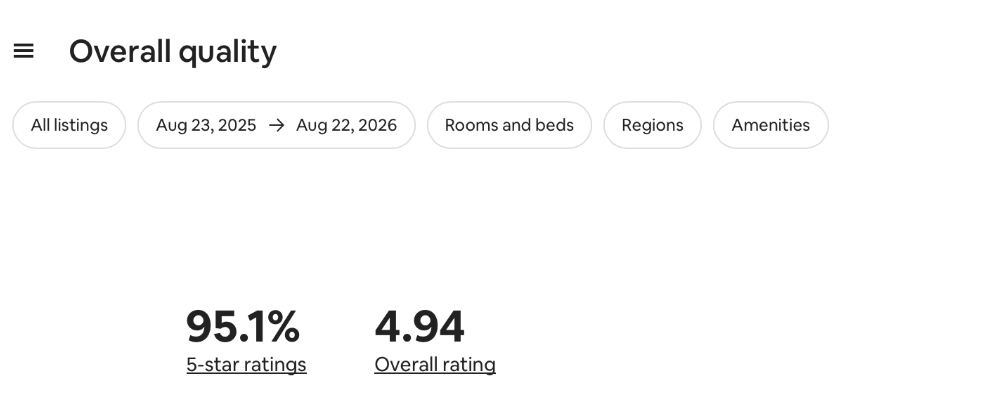
Airbnb dashboard
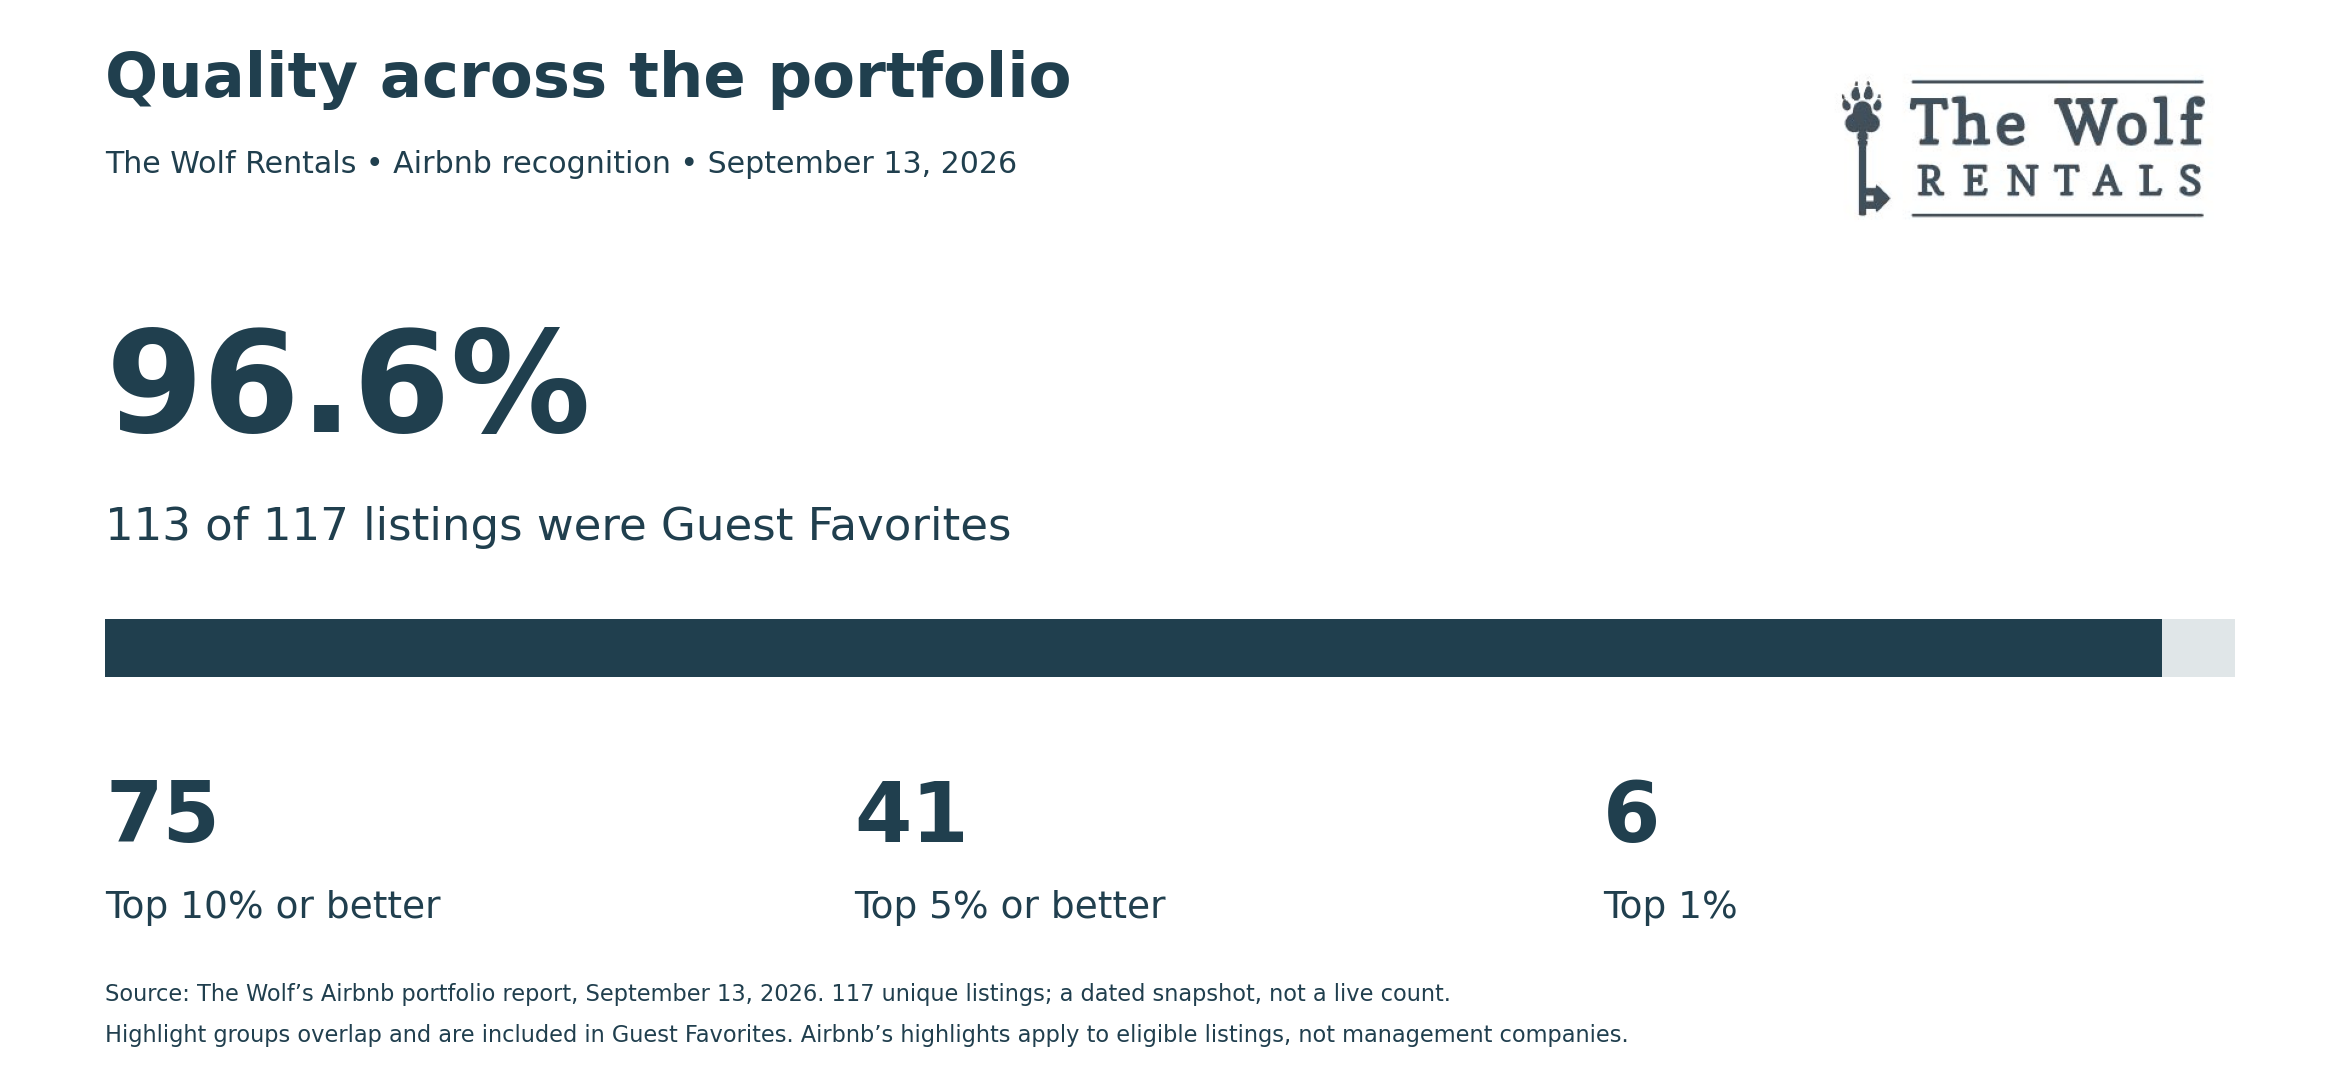
The Wolf / Airbnb
113 of 117 listings are Airbnb Guest Favorites. The badge is earned home by home. Across our portfolio, 96.6% of homes carry it.
Ahead in every guest-rating category.
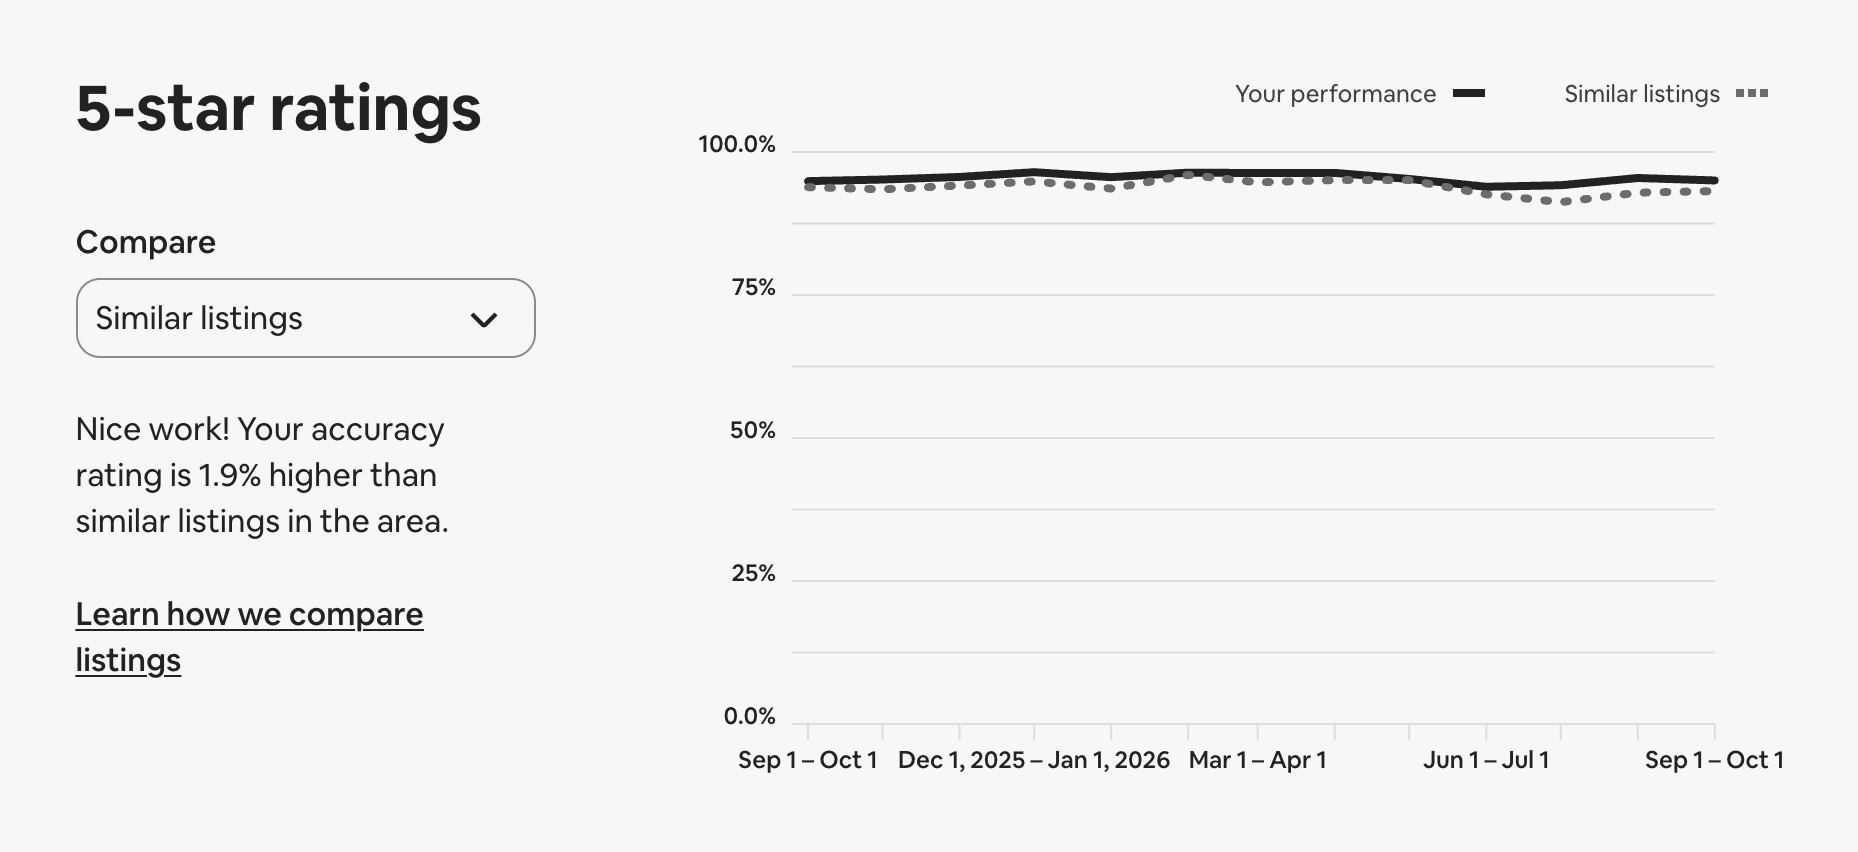
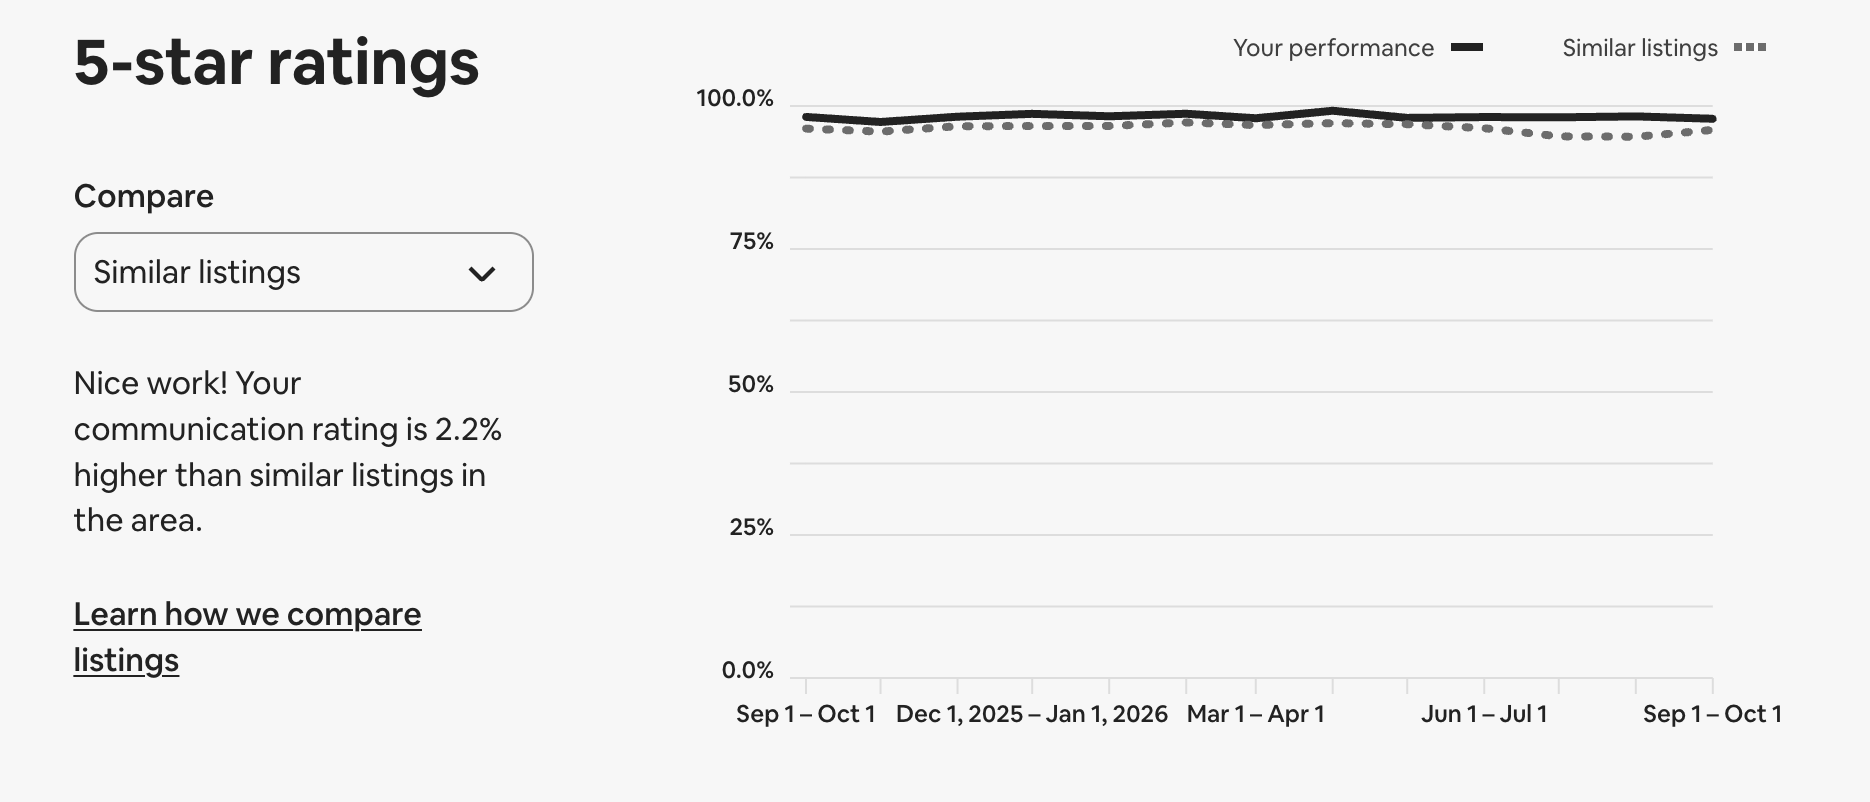
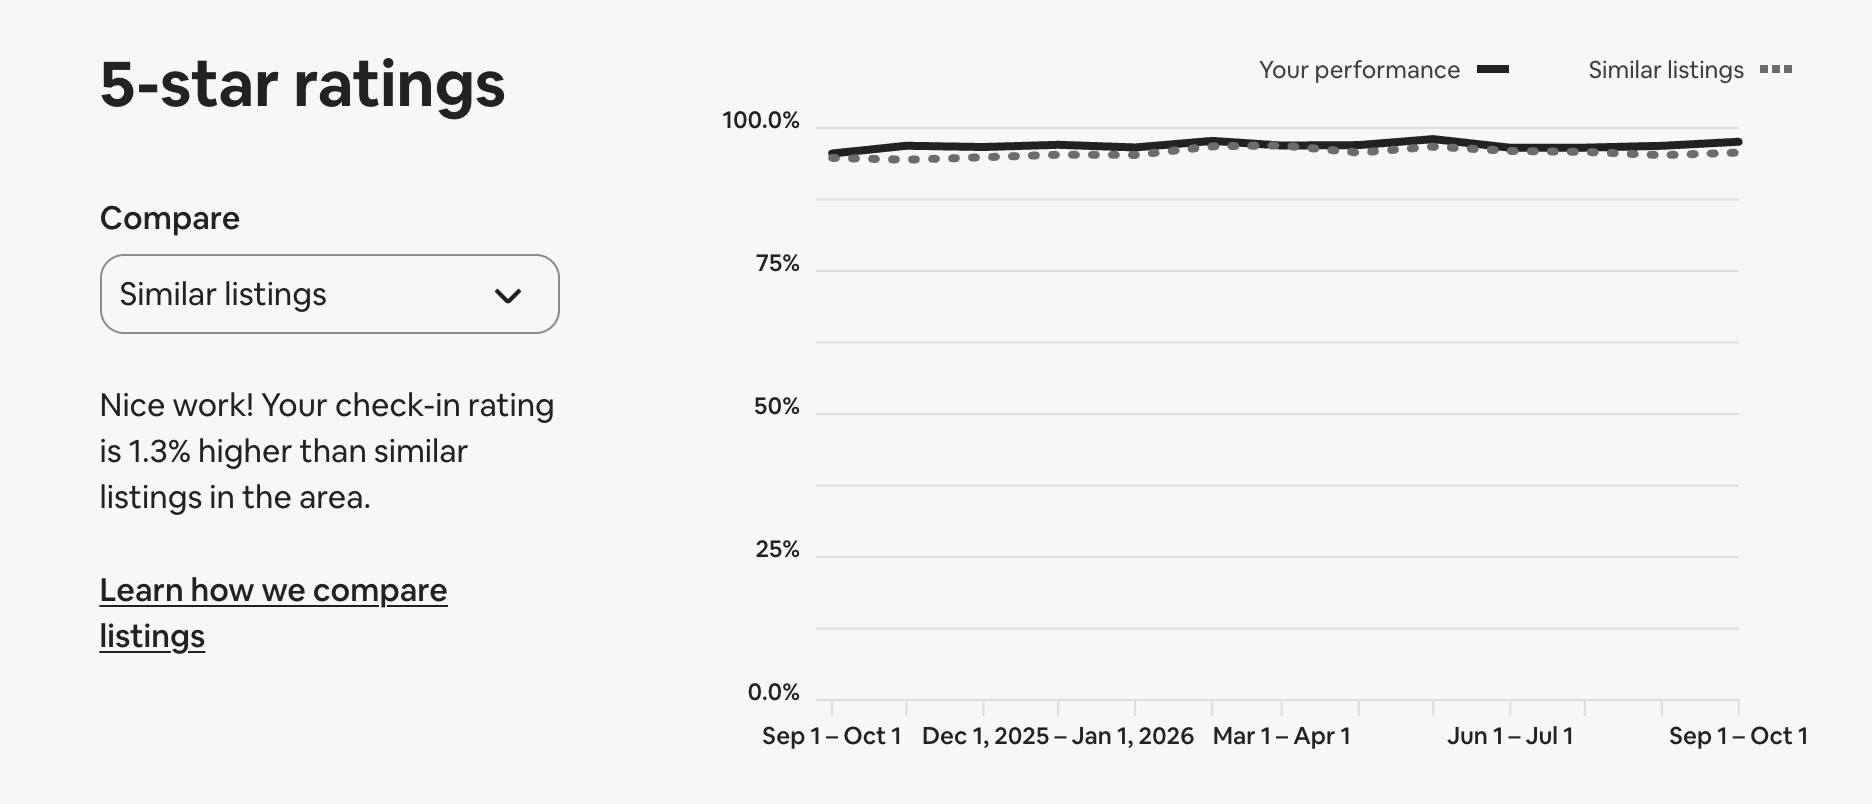
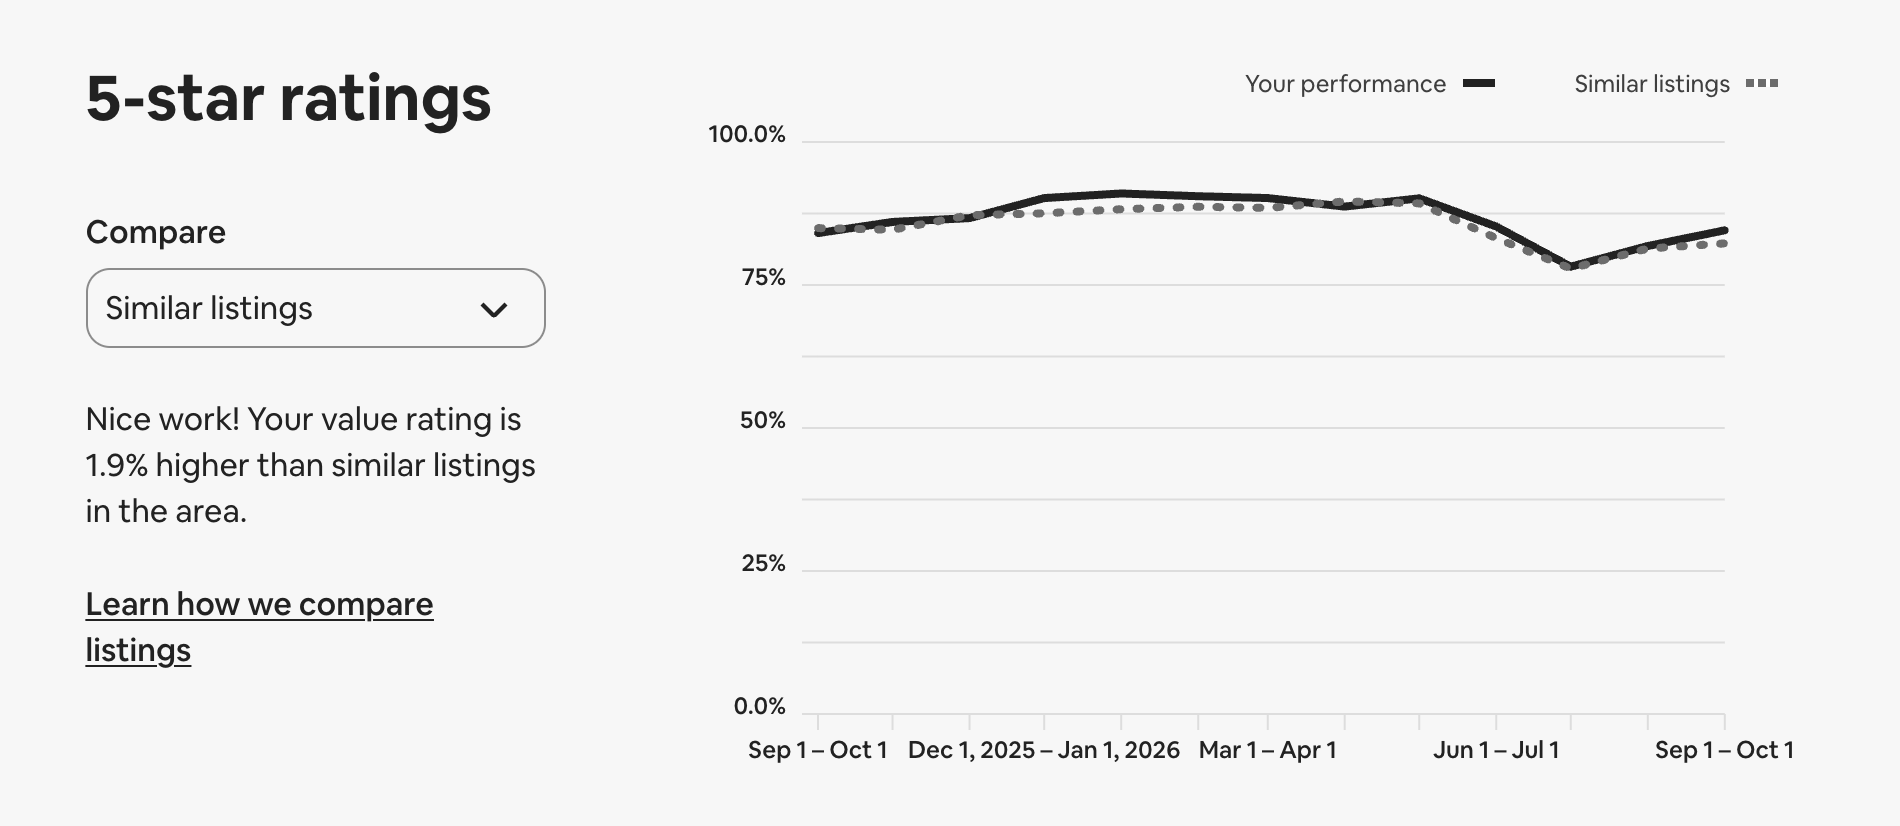
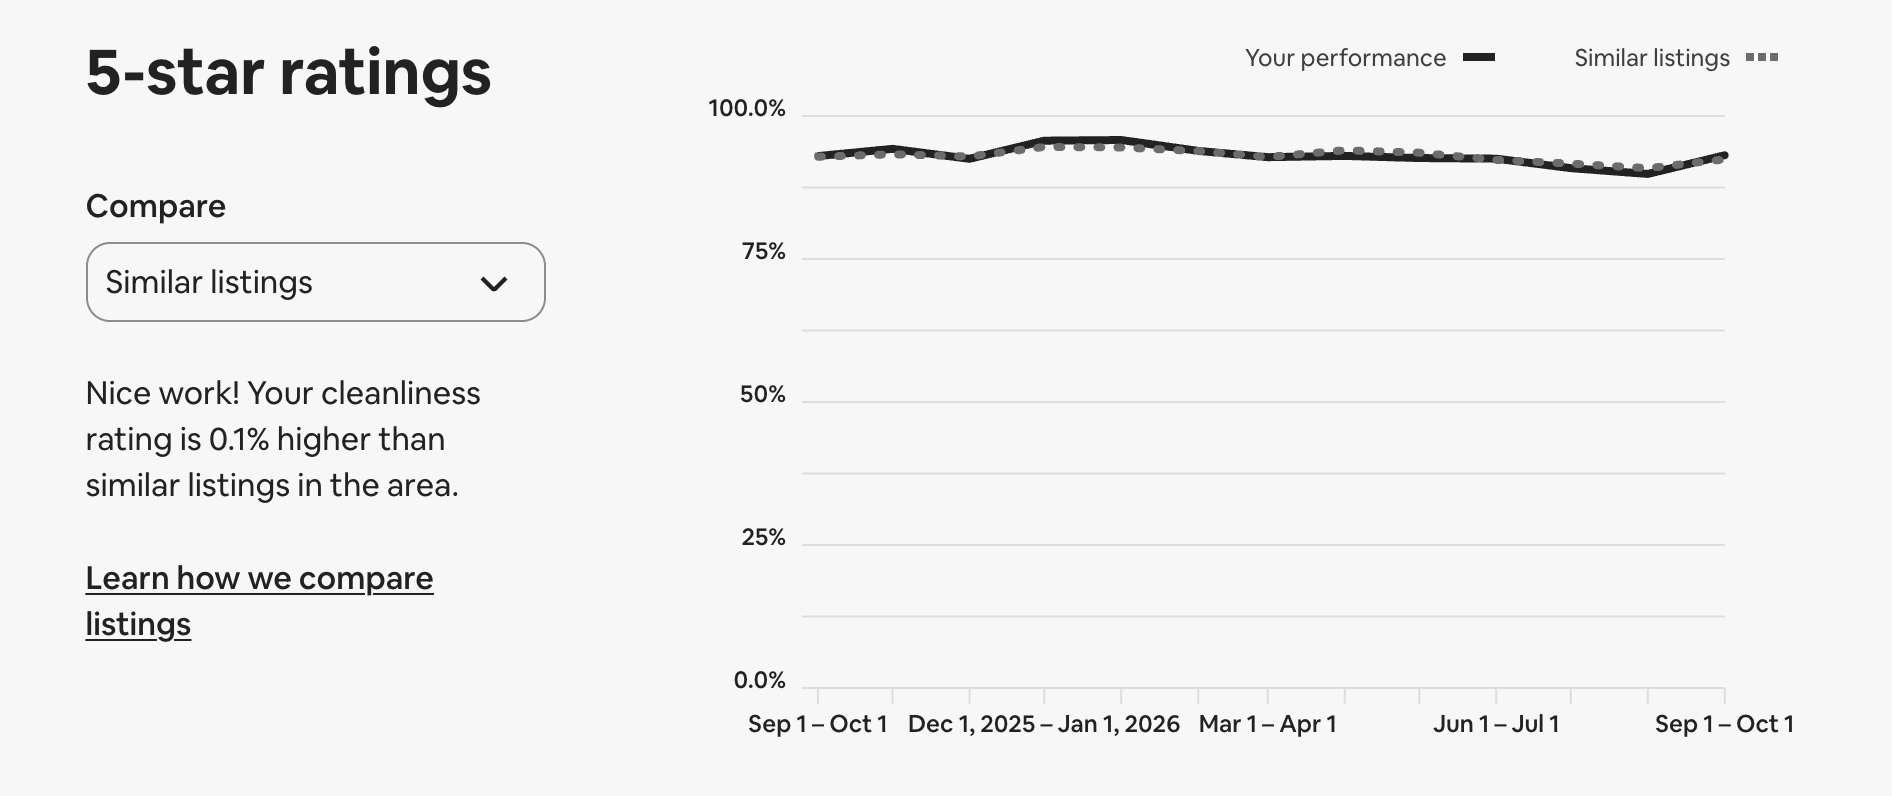
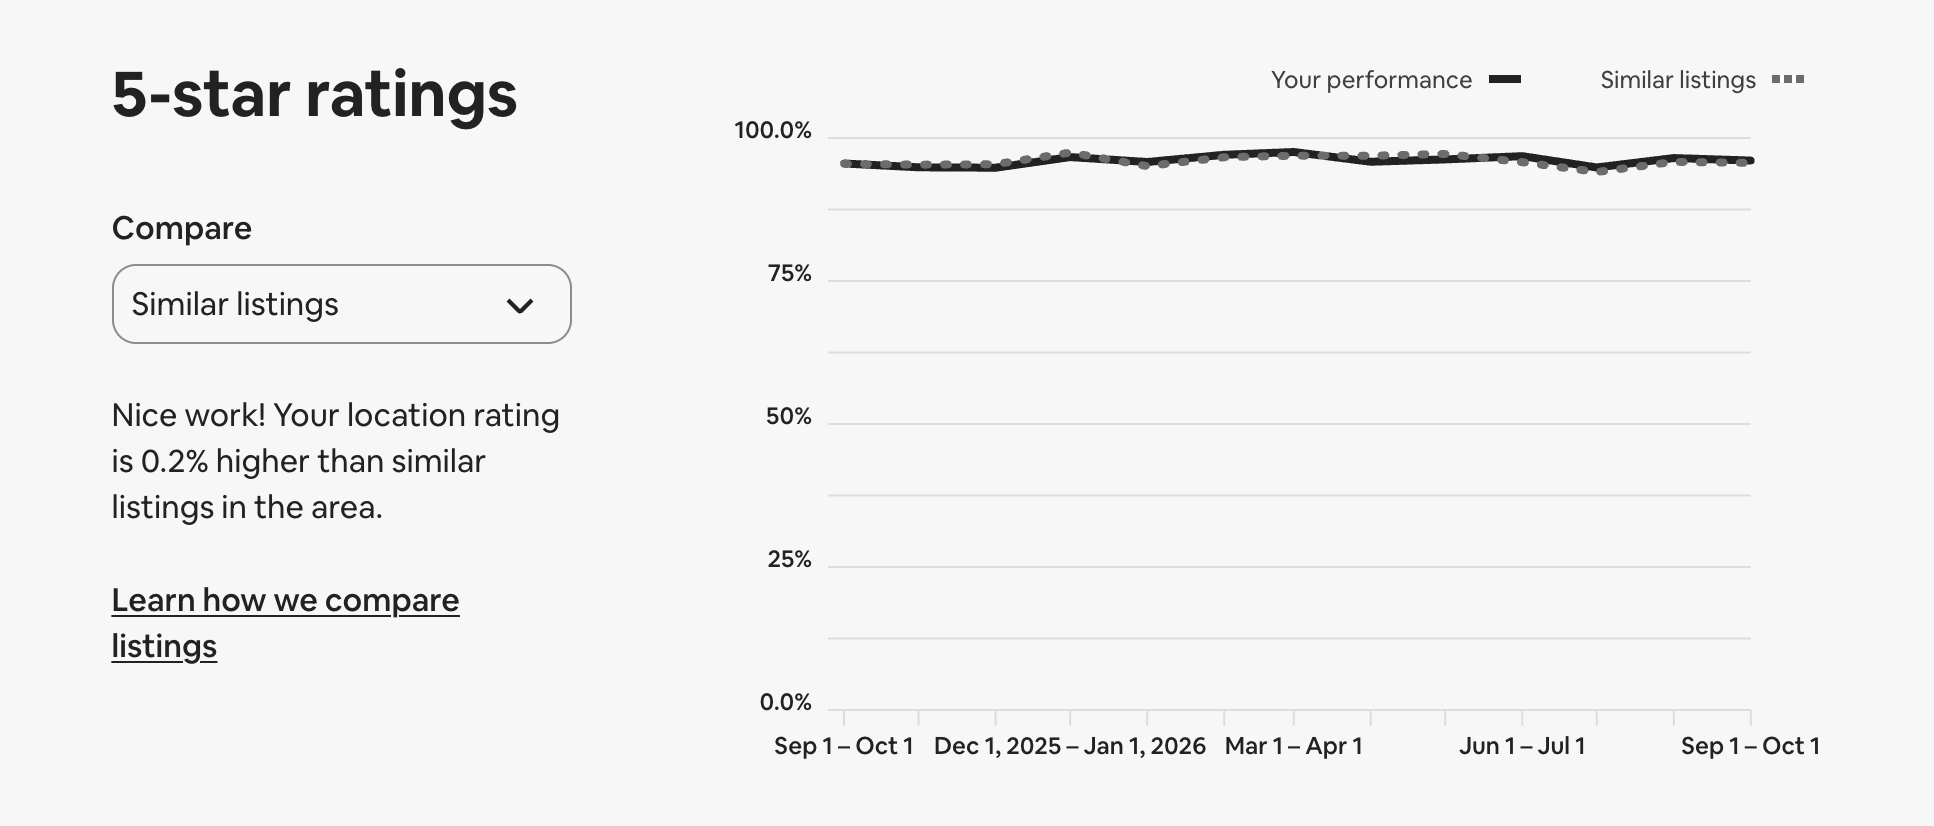
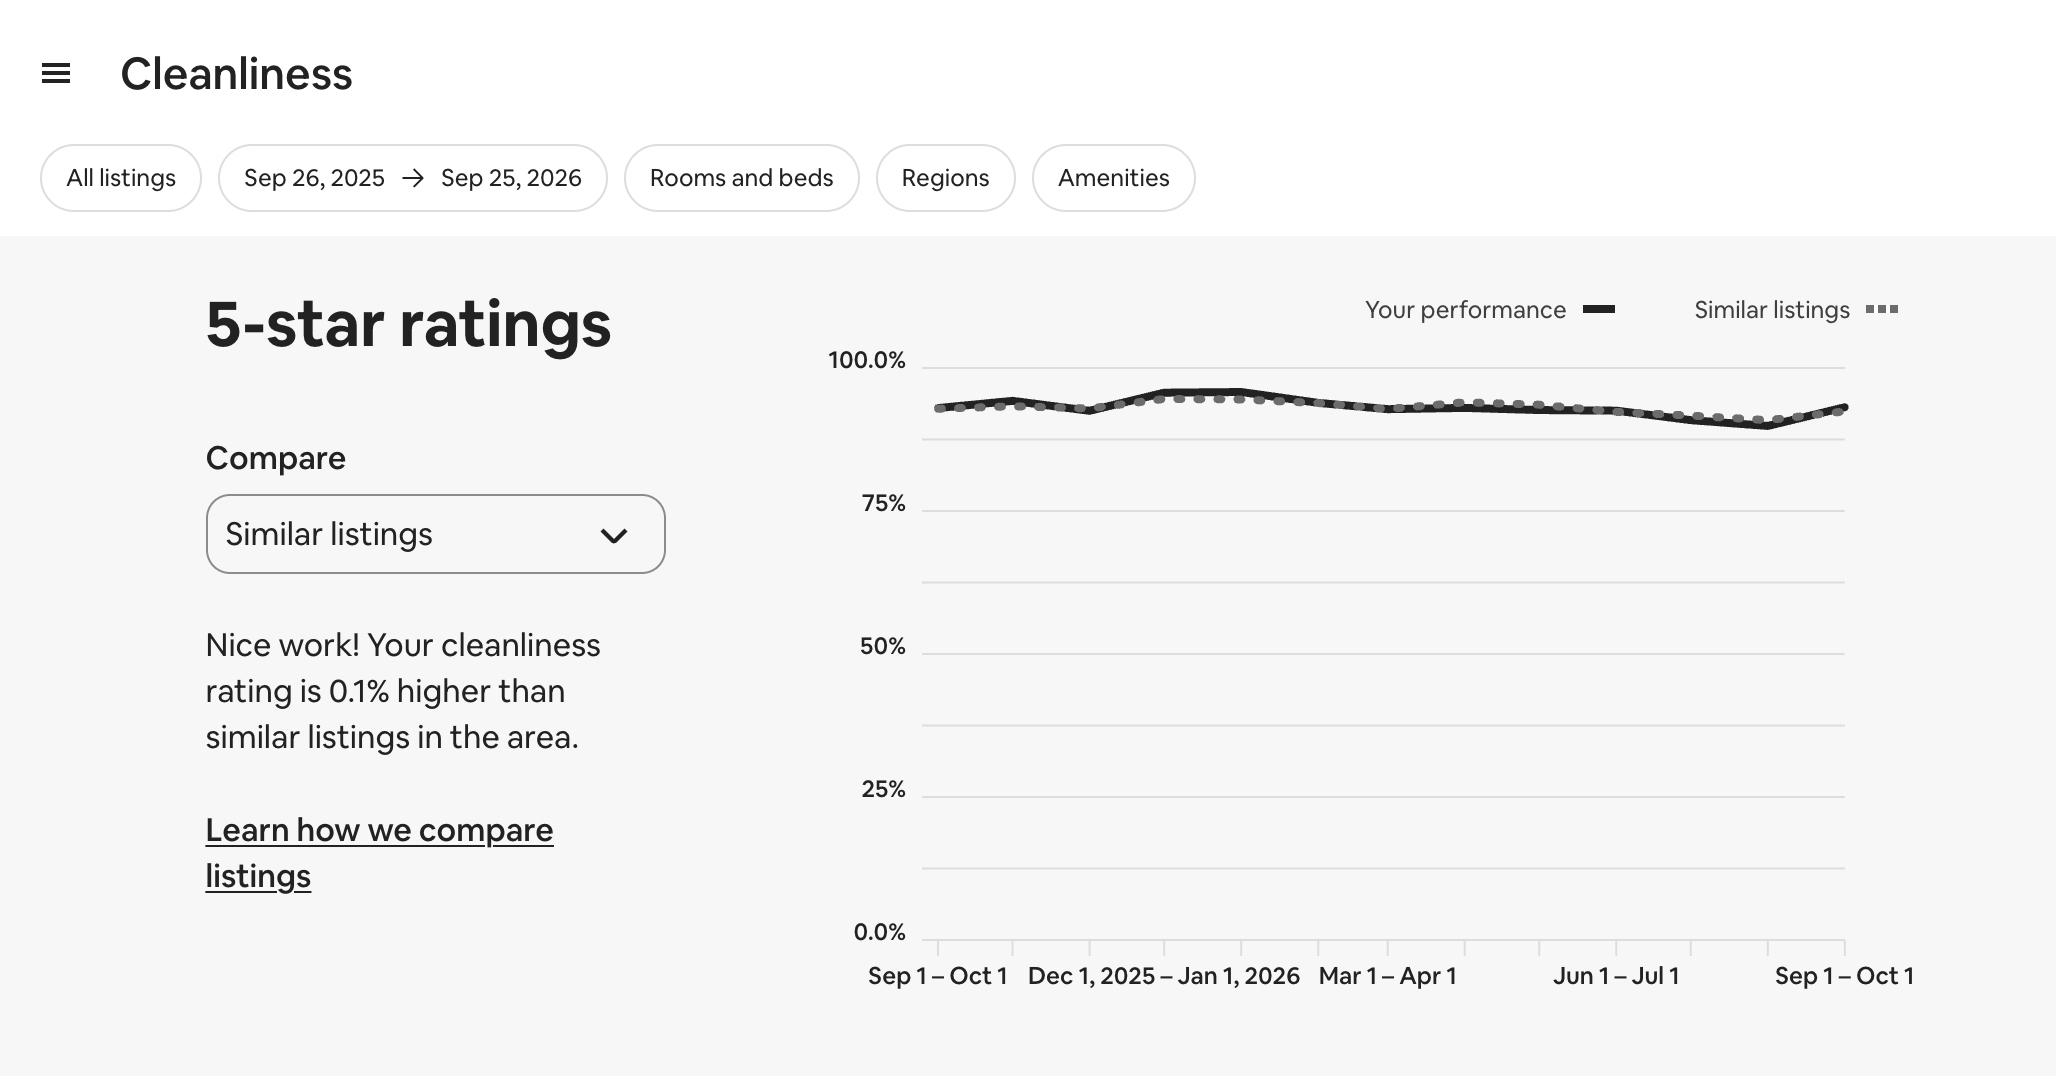
Airbnb compares our homes with similar listings nearby. Our five-star share is higher in every category it measures.
| Airbnb category, five-star share vs. similar listings | The Wolf |
|---|---|
| Overall quality | +2.0% |
| Communication | +2.2% |
| Accuracy | +1.9% |
| Value | +1.9% |
| Check-in | +1.3% |
| Location | +0.2% |
| Cleanliness | +0.1% |
| Occupancy | +35.2% |
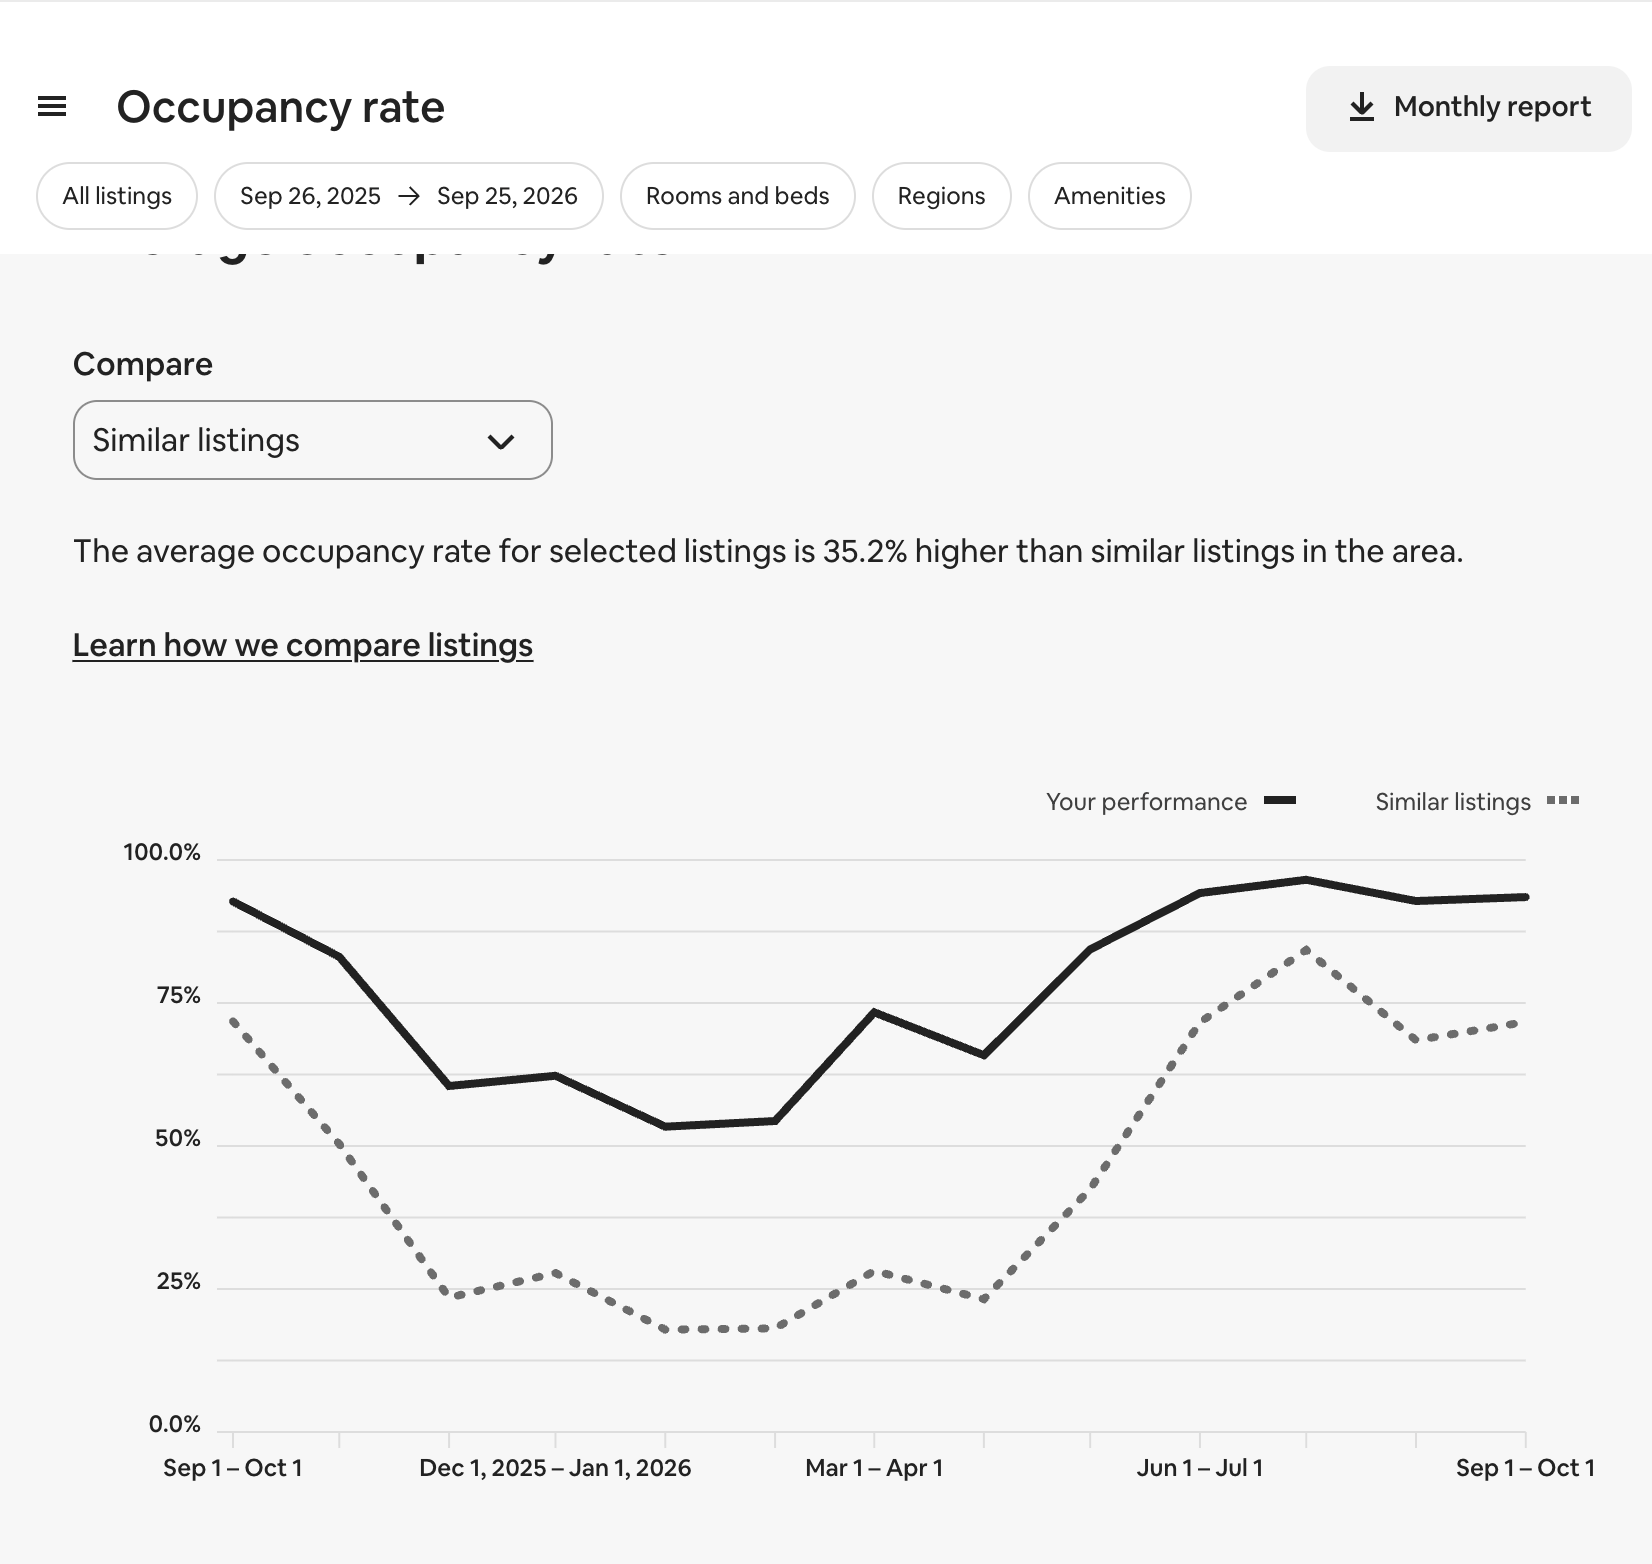
Airbnb dashboard
See all seven Airbnb category screenshots
120 homes. One standard.
High ratings get harder to sustain as an operation grows. AirDNA reports an average rating of 4.71 for managers with 100–249 listings. The Wolf’s Airbnb rating is 4.94.
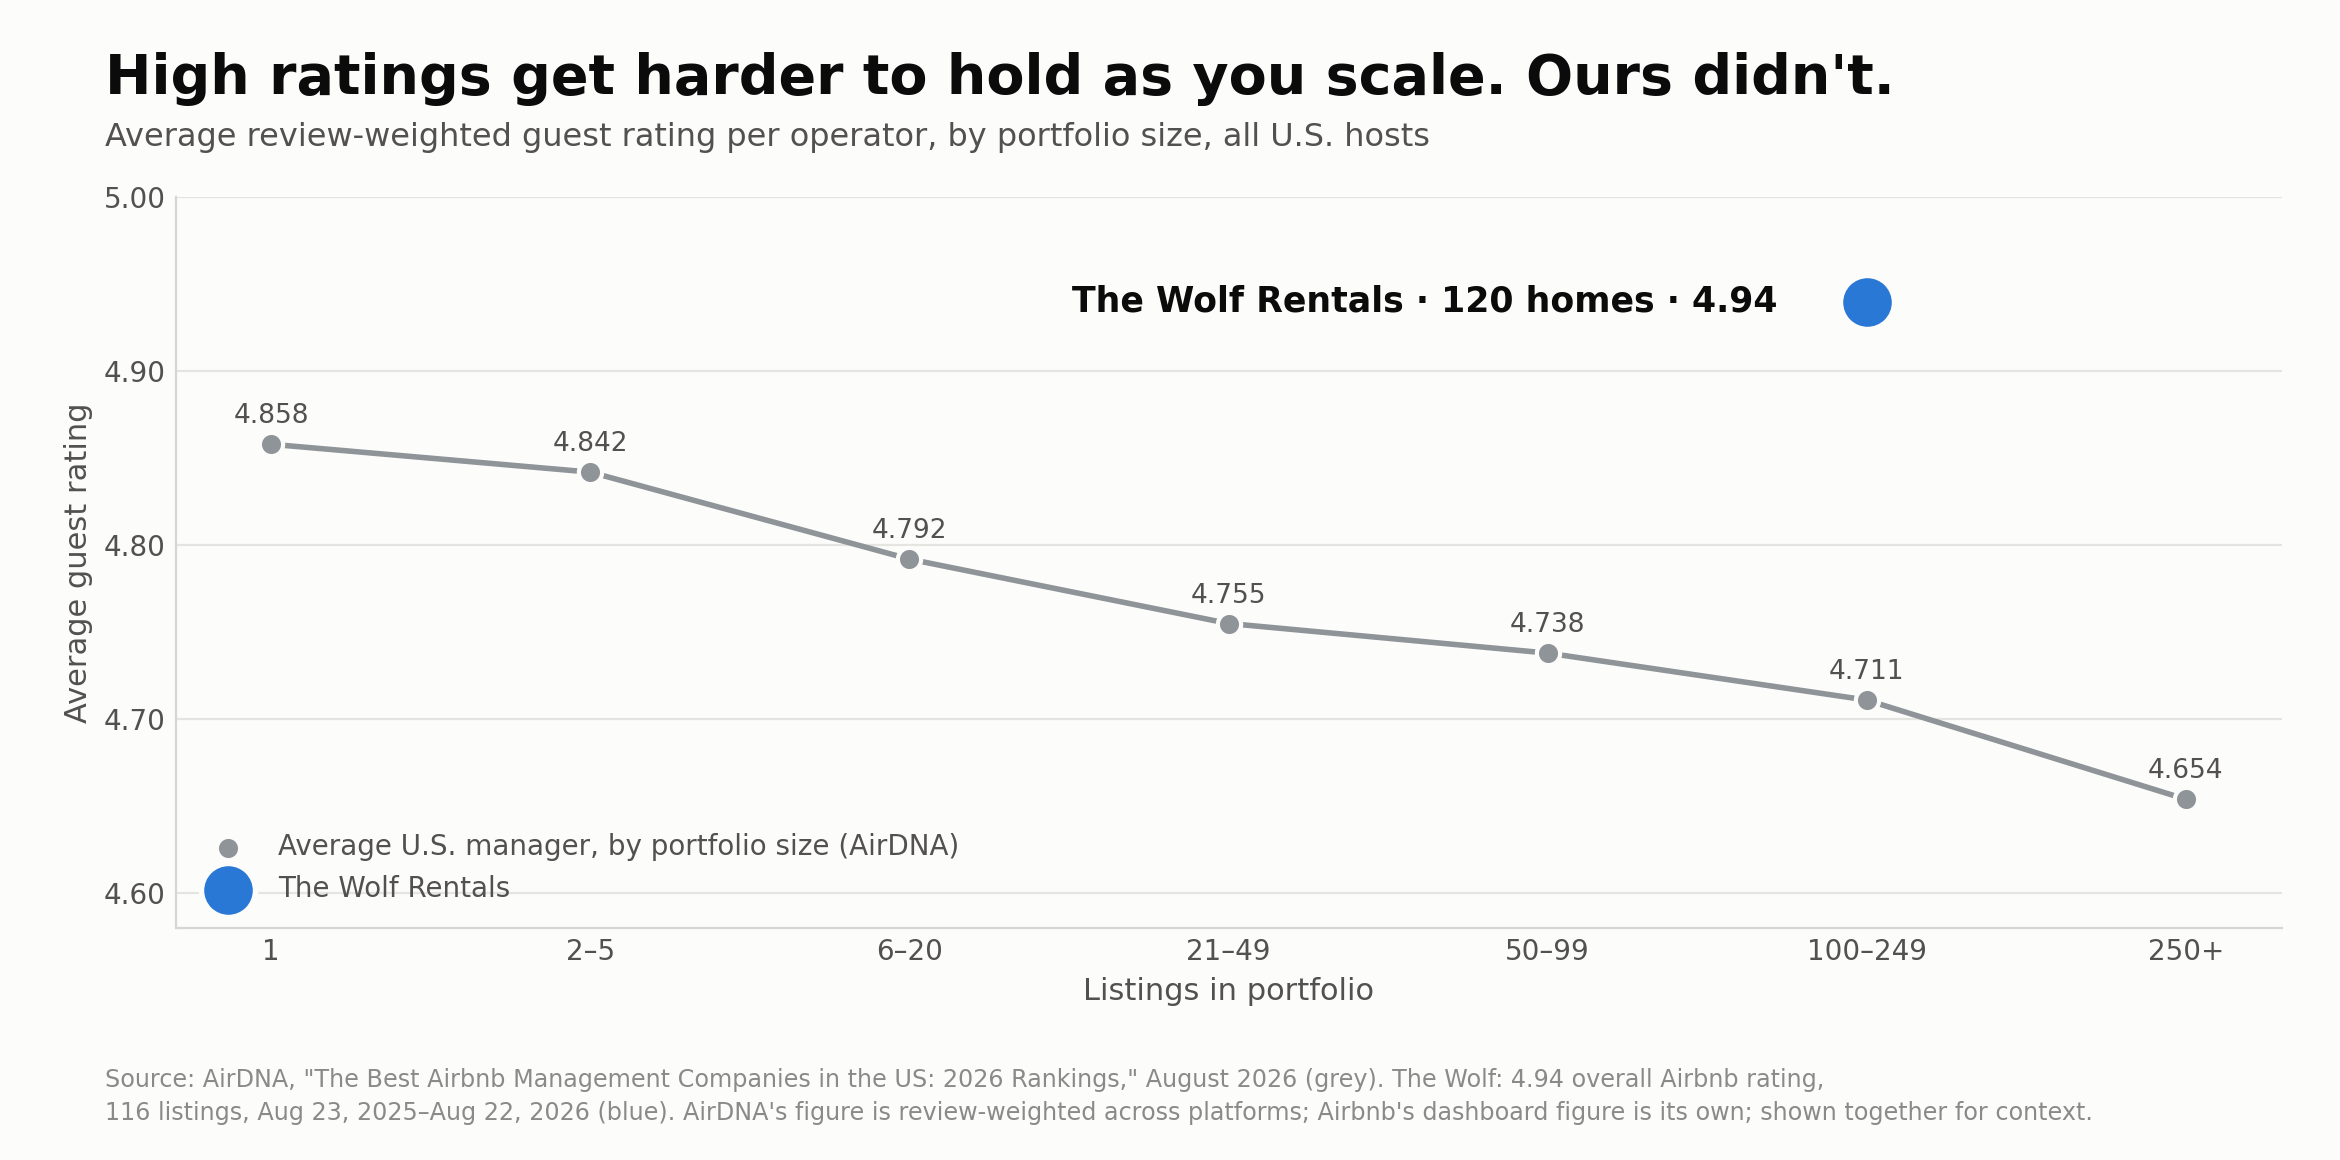
Other local managers with more than 45 homes score 4.65–4.84. Our 4.94 spans homes from the Longs Peak trailhead toward Lyons, high into Windcliff and nearly to the Highway 34 park entrance.
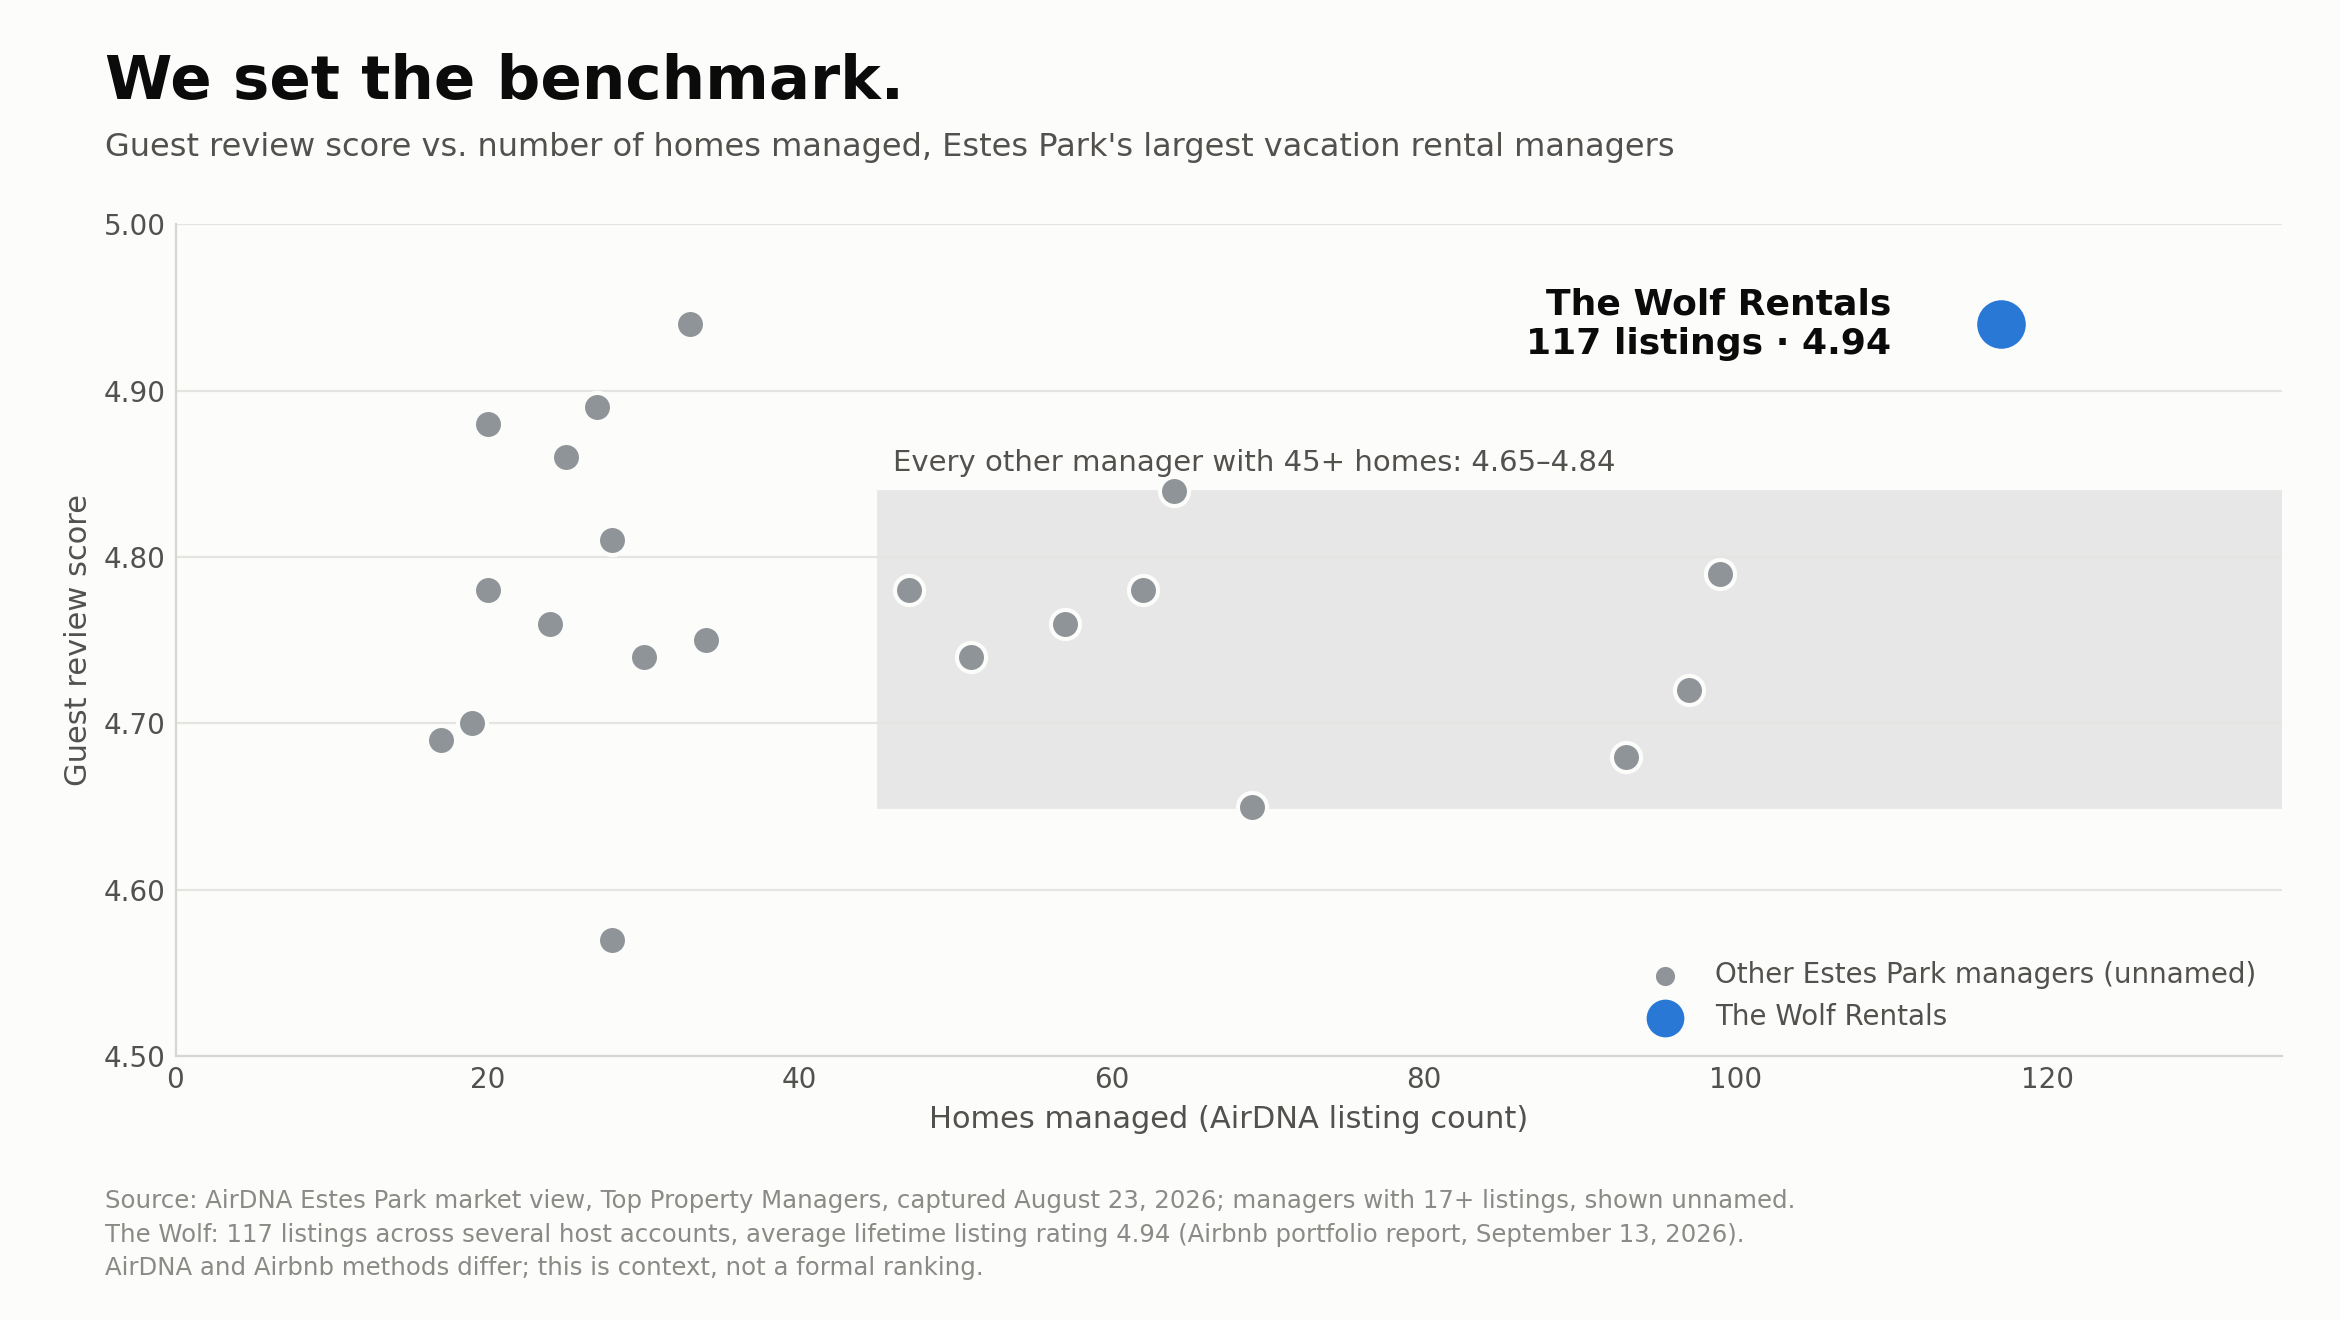
AirDNA / The Wolf
We doubled in size. The scores didn't move.
We doubled our inventory in 2025. Our five-star share held at about 95%. Growth means little if service slips. Our standard held.
Guests keep telling us
In our latest annual review analysis, guests submitted 7,540 Airbnb reviews across 116 homes. 95.1% were five-star. That is a track record built one stay at a time.
1.1 million more page views.
Airbnb reports 1,136,828 more page views than similar listings over the year ending September 24, 2026. More guests seeing the homes. More demand for our pricing team to work with.
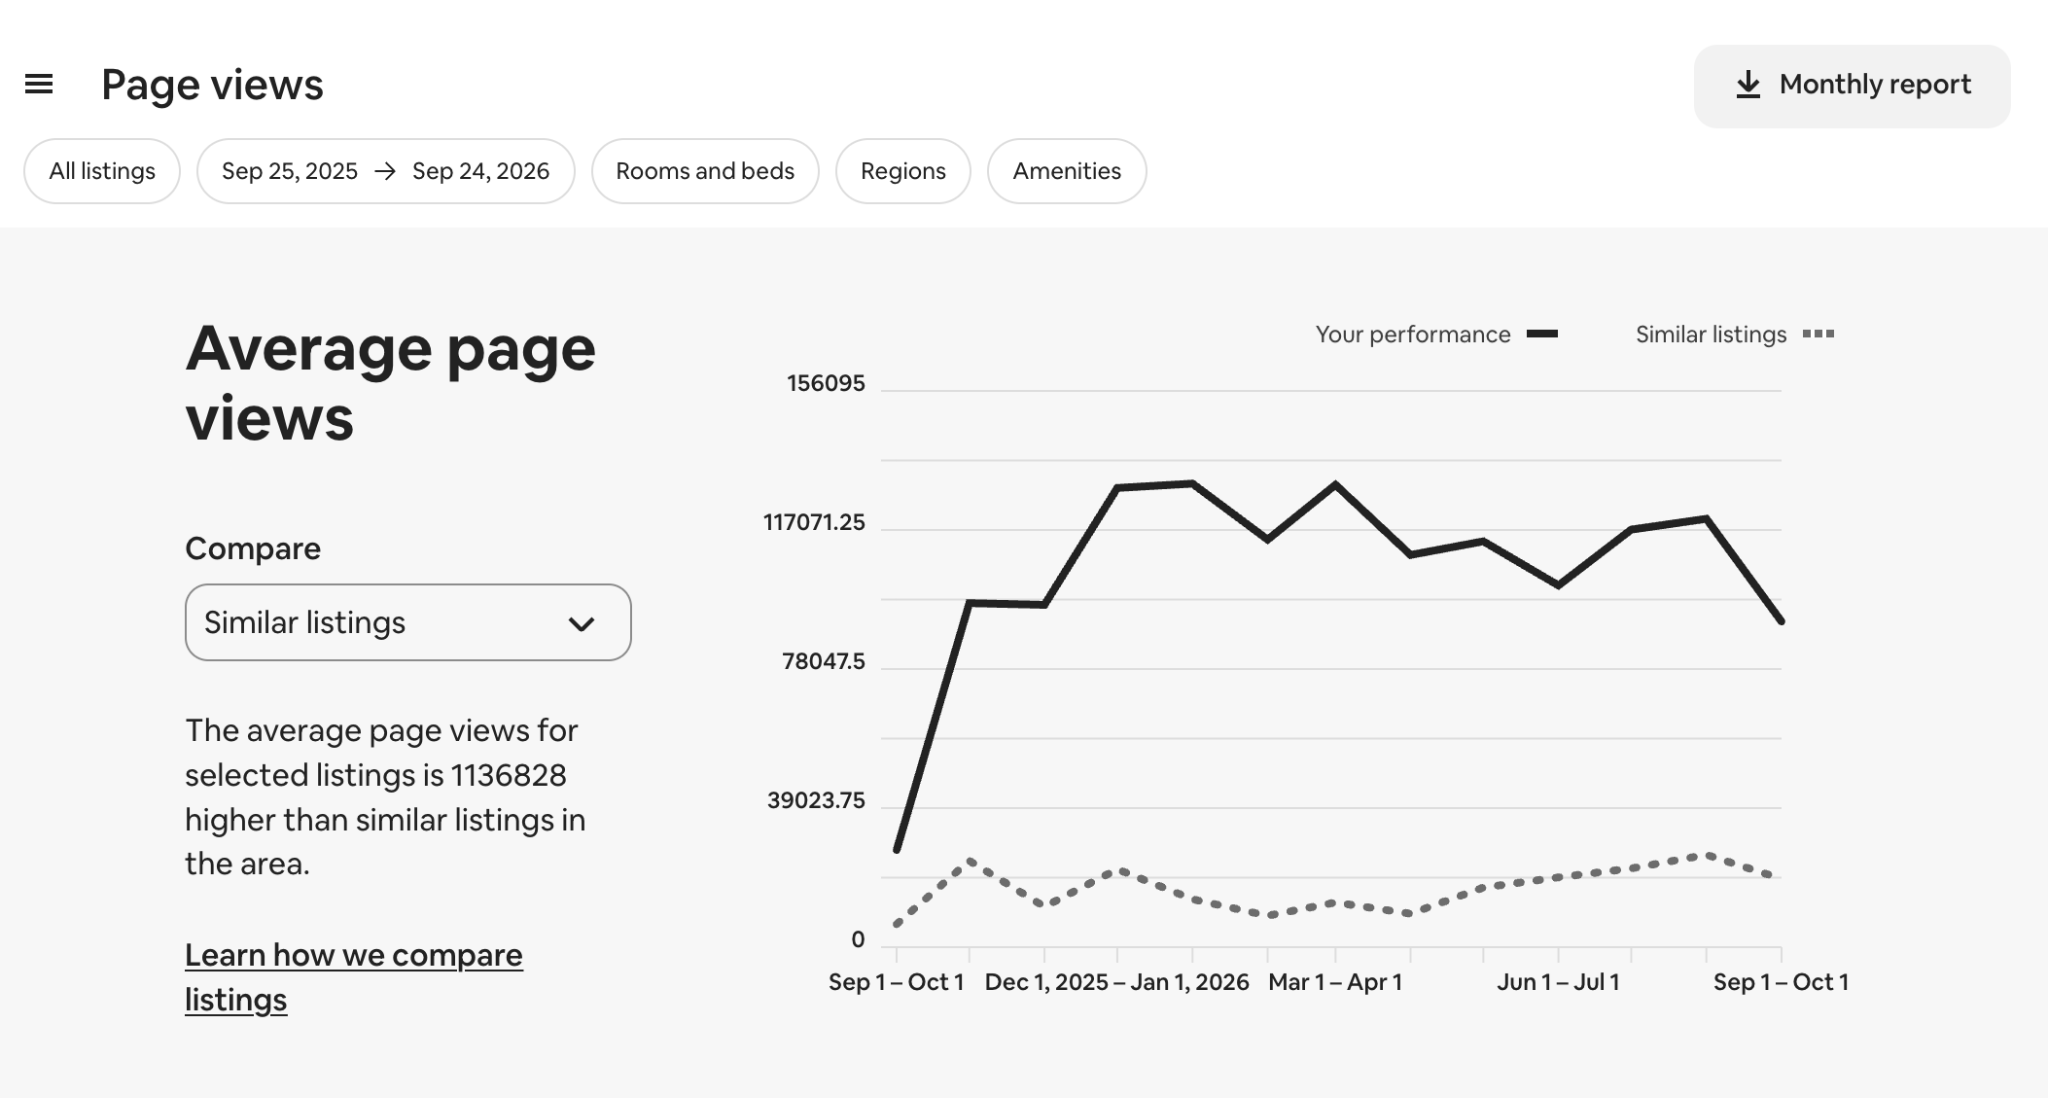
Airbnb dashboard
Same-size homes. More booked nights.
Compare the same bedroom count over the same dates.
| Home size | The Wolf | Market | Proof |
|---|---|---|---|
| 1 bedroom | 84.4% | 48.7% | Source |
| 2 bedrooms | 74.1% | 47.0% | Source |
| 3 bedrooms | 73.3% | 34.5% | Source |
| 4 bedrooms | 75.5% | 38.1% | Source |
Key Data · September 26, 2025–September 26, 2026 · Adjusted paid occupancy, compared by bedroom count.
Same-size homes. More revenue.
| Home size | The Wolf | Market | Lift | Proof |
|---|---|---|---|---|
| 1 bedroom | $170 | $109 | +56% | Source |
| 2 bedrooms | $178 | $165 | +8% | Source |
Key Data · September 26, 2025–September 26, 2026 · Before fees and expenses.
Earlier revenue comparison
| The Wolf | Estes Park market | |
|---|---|---|
| Adjusted paid occupancy | 80.2% | 43.2% |
| Revenue per available night | $269 | $158 |
| Average nightly rate | $336 | $365 |
Key Data, Same Store 2026 group, August 1, 2025–August 31, 2026, as of August 23. Revenue per available night is before fees and expenses.
The dead of winter
57.1% booked versus 15.4% for the market in February 2026. Our same-store group earned $104 per available night versus $35. Winter is part of the business.
Open the monthly comparison
| February 2026 | The Wolf | Estes Park market |
|---|---|---|
| Occupancy | 57.1% | 15.4% |
| Revenue per available night | $104 | $35 |
Nearly four times the occupancy and three times the revenue in the month most Estes Park homes sit dark. Across the whole portfolio, from November through April, our homes ran between 53% and 73% occupancy while the market ran 16% to 29%. Why it matters: you earn in January and February, and regular occupancy brings guests and our team through the home throughout the winter.
| Month | The Wolf occ. | Market occ. | The Wolf rev/night | Market rev/night |
|---|---|---|---|---|
| Aug 2025 | 96.7% | 62.9% | $416 | $243 |
| Sep 2025 | 94.3% | 61.4% | $358 | $217 |
| Oct 2025 | 88.7% | 50.4% | $284 | $160 |
| Nov 2025 | 68.6% | 24.9% | $172 | $71 |
| Dec 2025 | 64.8% | 27.9% | $192 | $92 |
| Jan 2026 | 56.7% | 16.1% | $119 | $42 |
| Feb 2026 | 57.1% | 15.4% | $104 | $35 |
| Mar 2026 | 77.4% | 23.9% | $154 | $55 |
| Apr 2026 | 69.0% | 21.4% | $127 | $51 |
| May 2026 | 85.1% | 40.9% | $230 | $121 |
| Jun 2026 | 94.8% | 65.9% | $410 | $284 |
| Jul 2026 | 96.3% | 73.7% | $525 | $366 |
| Aug 2026 (to Aug 23) | 90.4% | 64.9% | $383 | $260 |
Quality makes money.
Better-reviewed 3-bedroom cabins have more than twice the estimated annual revenue in our PriceLabs comparison.
PriceLabs annual revenue estimates · Estes Park cabins · 3 bedrooms, 2 baths, 6 guests · September 2026. 4.7–4.8 source · 4.9–5.0 source
Great stays build the demand. Our team prices it.
The operation in numbers
120 homes. Full-time local staff. Professional revenue management. Overnight backup. The operation behind the guest rating.
Sources and definitions
Bedroom comparison. Key Data Company Overview, September 26, 2025–September 26, 2026, as of September 26, 2026. Active homes; Direct (Greater Estes Park); filtered by bedroom count; other property filters All. Adjusted paid occupancy removes owner blocks.
Airbnb dashboard. Professional hosting dashboard, Aug 23, 2025–Aug 22, 2026, 116 selected listings, captured Aug 23, 2026: overall rating, five-star share, first-page search impression rate (60.0%), and per-listing averages of 104,066 first-page search impressions and 11,618 page views. Page-views comparison: all listings, Sep 25, 2025–Sep 24, 2026; "1,136,828 higher than similar listings" is Airbnb's own readout. Category comparisons and occupancy: all listings, Sep 26, 2025–Sep 25, 2026, captured Sep 25, 2026; each figure is Airbnb's own "higher than similar listings in the area" readout for the five-star share in that category. Airbnb defines "similar listings" as comparable listings in the area and compares against their average. Superhost status per Airbnb's quarterly assessments.
Key Data, full portfolio. Company Overview, Sep 25, 2026: all active units vs. Direct (Greater Estes Park), Sep 25, 2025–Sep 25, 2026, monthly adjusted paid occupancy (Nov 59.3%, Dec 61.3%, Jan 53.3%, Feb 54.8%, Mar 73.4%, Apr 65.6% vs. market 25.8%, 28.8%, 16.4%, 16.0%, 24.5%, 21.6%); full-portfolio 75.7% vs. 42.8% occupancy and $221 vs. $158 per available night. Growth: calendar 2026 as of Sep 25 vs. calendar 2025 as of Sep 26, 2025: unit revenue recognized $8,250,542 vs. $5,672,216 (+45.5%), guest check-ins 10,402 vs. 7,013 (+48.3%). A changing portfolio; not same-store growth.
Airbnb portfolio report, Sep 13, 2026. 117 unique listings: Guest Favorite and highlight designations (groups overlap; all 75 highlighted homes are Guest Favorites), lifetime average rating per listing, and lifetime and trailing-365-day booking counts (Airbnb's counts include cancellations). Designations are re-evaluated by Airbnb daily; this is a dated snapshot.
Trailing-12-month review analysis. Hostaway guest-review export dated Sep 13, 2026; Airbnb reviews submitted Sep 13, 2025–Sep 12, 2026. 7,540 reviews across 116 Estes Park homes; review-weighted mean 4.93992 (4.94), 95.0928% five-star. Communication: 7,400 of 7,540 ratings were five-star (98.14%). Per-home means use unrounded values: 90 at least 4.90; 115 at least 4.80. These are recent-review averages, not Airbnb’s lifetime listing scores. Kentucky homes, Rock Nook, and Estes Park Outfitters Lodge are excluded consistently with the portfolio’s review analysis. The separate 117-listing badge snapshot is dated Sep 13, 2026.
Review rate. The Wolf's internal calculation: guest reviews received divided by completed stays, approximately 70%.
Key Data. Custom group "Same Store 2026" vs. "Direct (Greater Estes Park)," Aug 1, 2025–Aug 31, 2026, as of Aug 23, 2026; a 13-month window with an unfinished final month; different property mixes. Adjusted paid occupancy is booked nights over available nights, with owner blocks removed. Revenue per available night (RevPAR) is rate times occupancy: what each night on the calendar earned, booked or not, before management fees and property expenses. Average nightly rate (ADR) is revenue per booked night.
PriceLabs. Revenue Estimator Pro, reports created Sep 25, 2026, for one Estes Park address; 3 bedrooms, 2 bathrooms, entire cabins, 6 guests. Groups contain different homes; the higher group combines rating with 100+ reviews. Estimated revenue excludes taxes, cleaning fees, and other charges. The comparison shows the size of the gap between rating tiers in this market, not what one home would gain by moving tiers.
AirDNA. "Best Airbnb Management Companies in the US (2026)," Aug 26/30, 2026: national funnel (960,000 hosts → 220,000 → 7,168 → 920 → 668 → 212 → 18 → 10), share of hosts at 4.9+ and average rating by portfolio size, the Guest Loved & OTA Badged award (92.4% top), and the top ten (4.94–4.96 as displayed). Local winners and the Estes Park Top Property Managers table from AirDNA's market data, August 2026 (managers with 17+ listings; The Wolf's homes sit under several host accounts and are combined into one point). AirDNA's ratings are review-weighted across Airbnb, Vrbo, and Booking.com; Airbnb's dashboard rating is Airbnb only. Shown together for context; "would tie for sixth" places our 4.94 on AirDNA's displayed table, not in its calculation.
Portfolio and forecasts. Property value is The Wolf's Sep 2026 estimate of owners' homes under management, not company-owned real estate. 2027 figures are rounded planning forecasts, not results; guest spend is not owner income or company revenue.
What could your home do with The Wolf?
Send us the property. We’ll look at the opportunity and follow up by email.

The Wolf Rentals is an independently operated vacation rental management company built in Estes Park, Colorado: 120 homes, a full-time local team with overnight backup, and professional revenue management.